Something has (still) been preventing me from getting to this blog regularly. Actually, it’s two things…
Welcome, little guys!
Their names are Buster and Ruby. They’re rarely still enough to photograph, but they are absolutely a part of our family now.
I have a day off for spring break, though, and (if Buster and Ruby will stay off the keyboard for a few minutes), I’m going to give blogging a shot. I have a million ideas saved up; here’s one I hope you like.
The completely-generic-content report
At least once a a year I seem to get a question on dynamic report contents and answer it here; to list just a few (by year):
While all these questions are different, the main problem-to-solve is: how do you create a report layout that handles unknown contents?
Recently I had a good reason to do this myself. But, in this case, I wasn’t arranging charts based on unknown data, or figuring out how to layout a table based on unknown data, or positioning images and text based on directions held in the data. Instead, I wanted the report layout engine to get completely out of the way.
Here’s what happened.
A very long time ago, I wrote an application that had a very flexible query interface tuned to business needs. (I blogged about one aspect of this query interface: the ability to categorize questions about dates according to some simple principles, which allowed the application to handle an incredible variety of questions.) The application was a kind of a wizard, which allowed the users to walk through their business query needs in an appropriate way. The datasets that were generated often had multiple tables, and weren’t regularly shaped at all.
Report delivery, in that application, wasn’t an afterthought, but it was very simply implemented in XSLT, rather than SSRS, so I didn’t need to figure out how a report would handle this kind of data. I provided a generic XSLT that would handle the datasets I dynamically produced, so users intially got a simple format, with tables, that imported well into Excel for additional user-powered manipulation. Users had the option to save their queries for repeated use. When they chose to do so, they were also able to specify customized XSLT that gave them much more exciting presentations.
Sometimes the medium is the message
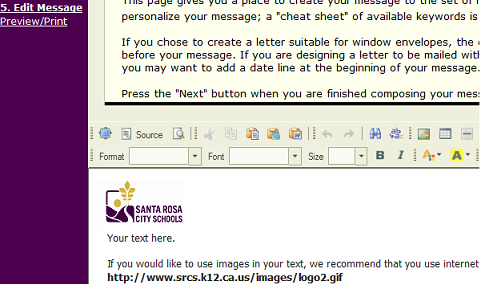
Recently, at the District, I wrote an application that does something similar; it allows school administrators to flexibly select groups of students, and then send messages to them and/or their guardians. This new application allows the users to provide the message, including customization through a simple mail-merge scheme (I supply the tokens, such as name values, that will be replaced if used in the message). The message is richly formatted, using an open source widget called CKEditor, which comes in a .NET flavor. I’ve slightly customized it, but it’s great out-of-the-box.
Users can even provide signature images and embed them in their content. This works best if we host the image on a website for them, so we don’t recommend it for emails (for printing, an internal website host for signature files suffices).
When the message has been written by users, the dynamically-generated query drives the sending and customization of messages (the contact names and addresses), not the content of the messages.
How are the messages sent?
Users can opt to have the messages sent by email, in which case .NET code takes over within the application. But they can also choose to have the messages sent by post mail; this is often a better delivery mechanism for us, since we don’t have opt-in emails for everybody.
When they choose print, an SSRS-hosted report handles output. The report allows them to specify letters-only, and formats their content framed by a window-envelope suitable address, or mailing labels only, or both.
Why the labels-only choice? Sometimes users aren’t able to get window envelopes, but it’s often more convenient for them to print their labels and letters separately, because of the different stock requirements.
When they choose “both”, the application provides an accurate count, and tells them exactly how many label sheets need to proceed the plain paper stock in the printer.
So… what does this report look like?
Unlike other dynamic reports we’ve discussed, this report has one dataset and the columns for this dataset are stable. They include “flattened” information for each row, such as the name of the student’s school and its address, because the report optionally contains the school address as part of its “letterhead”. This option is controlled by a parameter; all the parameters are discussed further below.
The report has two major sections: the first handles labels and the second handles printed report pages. Note that the labels are laid out first in the report body, since they have the more exacting positioning requirements. Getting the leftmost label to butt up against 0,0 in the body seems to be the easiest way to handle that.
Each of the two major sections has a Visibility requirement, hidden depending on whether the user has chosen labels, letters or both.
The table representing the letter, which is the one with dynamic content, has a page break on its Details group, so that each recipient gets a separate letter.
Note that, while we recommend a one-page letter, multiple page content will still work properly, but the possibility is another reason we place labels before letters in the content; otherwise, we could not give a proper count of the label stock required in a combined run.
The layout of the letter-table is extremely simple; as you can see below, there’s a letterhead followed by appropriately-positioned recipient address (suitable for window envelopes), and then no salutation or anything else; the message from the user is one big “blob” in the layout, of course with CanGrow=True.
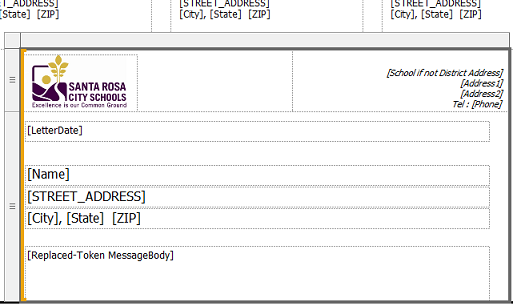
So where’s the dynamic part? That’s up to a couple of parameters, and a surprisingly small amount of code.
Here’s the full set of parameters:
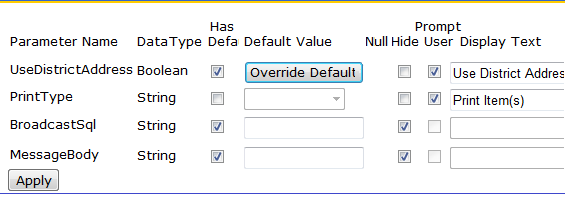
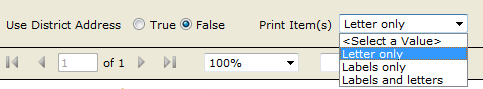
The first two parameters are user-controlled, and can be changed by the user during the report run. They allow the user to specify the return address, and the labels/letter print choices:
The second two parameters, which are hidden in the UI, supply the message body and the sql statement which will be run to supply the dataset. These two are passed to the RDL by the application, which has previously created them from user input.
The sql statement parameter is executed, as we often do in these cases, as a code function:
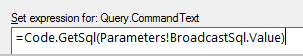
The code function ordinarily passes back the SQL that has been passed to it as a parameter. However, For debugging purposes, the function also has the ability to provide a static SELECT statement with one row; this aids in populating the dataset field list without a lot of work:
Function GetSql(ByVal tSql As String) As String
If String.IsNullOrEmpty(tSql) Then
Return “your sql statement here”
Else
Return tSql
End If
End Function
A second simple function provides the expression for the message body:
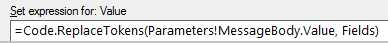
Notice that this function is passed the full Fields collection. As you can probably tell by its name, the function simply replaces mail merge tokens in the MessageBody parameter passed to it, with Replace statements such as the following:
retVal = Replace(retVal, “[[STUDENT_FIRST_NAME]]”, _
Trim(CSTR( tFields(“STUDENT_FIRST_NAME”).Value)))
… and that’s really all that’s needed.
Going even further
One additional bonus of this technique: as with my older application, even though the message delivery is very important here, the flexible query interface I’ve created is still the star of the show. Should users choose to leverage the query interface for additional output needs, beyond email delivery and the standard report format, they can make their selections and specify a custom RDL name, for different formatting.
Our IT department creates and deploys these additional RDLs for them; to work with the application, an RDL simply has to accept the known parameters. It doesn’t have to have the same dataset structure, because it doesn’t even have to use the SQL (although it can derive hints about the output by passing this value). It doesn’t have to support mail merge, if it’s not necessary, and of course it doesn’t have to implement the two visible parameters if they’re not appropriate. It simply has to accept (and hide/ignore) these values, because the application will pass them.
To facilitate IT developers’ use of this system, I supply a sample/template report showing exactly what to do. The body of this template is the instructions the developers need:
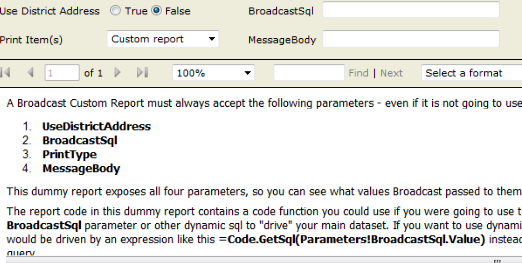
You can see the full output here: TemplateCustomReport.pdf (49.70 kb). The template RDL comes complete with stubbed code functions, matching the two functions that the standard report uses, but with additional ideas and instructions as comments.
Not everything in life fits this category
Ruby and Buster are definitely not “one size fits all”. Buster is going to be a really big cat, while Ruby seems as though she going to remain dainty even when she is an Adult Marauder instead of a Baby Kitten Marauder, even though they are siblings. Like many of your reports, each of our cats has a distinct character and is definitely special in his/her own way!
Still, isn’t it nice to know you can do something like this in SSRS, when you need to?