According to Wikipedia, the original Thirty Years’ War was “one of the longest and most destructive conflicts in European history”. I guess it depends on how you count; those of us in the analytics field know how many ways there are to spin statistics.
In any case, when I wrote two years ago, about my thirty years’ involvement with ways to create Snaking Columns in various reporting environments… I thought that was enough. I thought the ideas had gone as far as they could, I could bury my dead, so to speak, and never think about Snaking Columns again. I’d pared the subject down to the thinnest, most extensible way to handle the data problem already.
But wait, there’s more
Somebody just contacted me via the Techspoken form to ask me to respond to a stackoverflow request for help on this very subject. “Impossible,” I thought. “What is left to figure out?”
Uh-oh.
My method relies heavily on SQL windowing functions, so that the work in a report is as straightforward as possible. If you read the post, you’ll see that the requestor had been using a kludgy, non-straightforward, and hard-coded design strategy in the RDL, and I thought that all they had to do was get the dataset in order and they could remove all that stuff.
But the OP was using DAX, and my nested SQL logic didn’t ring any bells with them. Also, the OP was grouping items, and my examples didn’t include that requirement.
Once more into the breach, with yet-another-post
So, yeah. I looked into it, and I found not only that this was solveable in DAX but thinking about the innate method, abstracted from the SQL implementation, allowed me to simplify the SQL implementation, too.
Here’s what we need to do:
- Add the notion of filtering, using a second parameter in the examples, beyond the “Columns” parameter that I used to illustrate the fact that the code and report design don’t need to change when you change the number of columns you need, in this method. This second parameter is a stand-in another requirement that I imagine the OP would like to see handled: the set of values to be displayed may be filtered by the user.
- Re-pare the SQLdown a bit further, for this 2022 edition, with both Across-then-Down and Down-then-Across (aka traditional “Snaking”) versions and grouping accounted for, and responsive to both user-parameters.
- Work that same logic through in DAX, dealing with any disparities that come up when we do so.
- Late breaking news: the OP just told me page breaks are required. Which, in my version, should *not* make a difference, but I’ll add those on the grouping level and see what happens.
Reminder of the general approach:
In either SQL or DAX, what we’re trying to achieve is additions to our dataset that has a Row Index value and a Column Index value (and, if necessary, handle any grouping that would affect those numbers along with any filtering that the report might need). Then we can take a bog-standard Matrix control in the report and group by Row Index and Column Index, and all is well.
Summary of results:
Filtering was easy to account for, and without grouping SQL and DAX could be swapped into the same Matrix control in the RDL with absolutely no changes. With grouping, it’s a little harder in DAX, and an extra dataset accounting for group-level values plus couple of expressions needed to go into the report design to compensate. I’m hoping somebody more knowledgeable in DAX than I am can tell me how to make that little bit of complexity go away. (My basic problem is a lack of the partition by clause we have in windowing functions, in SQL.)

1. Sample filtering and grouping
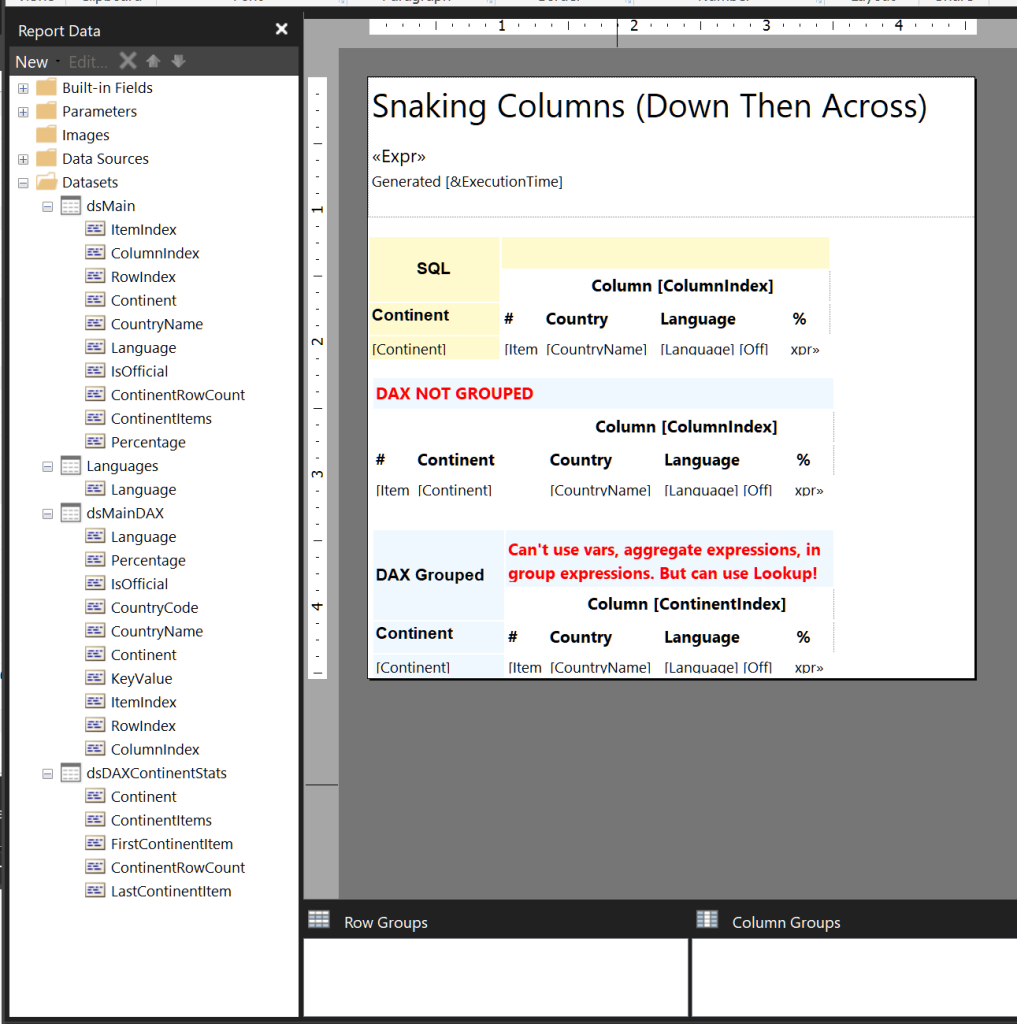
We start with our usual MSWorld database, as we did in the previous post. To illustrate a grouping requirement in this sample, we choose the Continent field.
In the screenshot above you see a “Languages” dataset. This is simply a picklist of all unique available languages, which I used for a Languages multi-valued parameter respected by all the “main” datasets. I happened to use DAX for this picklist, but it really didn’t matter:
EVALUATE SUMMARIZECOLUMNS('CountryLanguage'[Language]) order by [Language]The relevant SQL code will use this in an IN (@Languages) clause, and the DAX code will use it in a filter expression as follows: ContainsString(@LanguageList,CountryLanguage[Language])), where @LanguageList comes from a JOIN‘d set of the multiple values in the @Languages parameter, i.e. =Join(Parameters!Languages.Value,”|”). This usage is not really relevant to the OP’s actual dataset, I’m sure, it’s just for the sake of a fully-formed example.
2. Revised SQL
You’ll note, here that both the versions (Across-Then-Down and Down-Then-Across) no longer need to get a temporary set of column and row indexe. I guess I’m just 2 years older and wiser now!
Notice the partition by phrase in the ItemIndex, on Continent, which is the grouping level in our example. The idea here is that we want our ItemIndex to start from one again when we go to a new Continent group. This is critical to resolving one of the problems in the OP’s question; you want the new group to start in Column 1 of a new row, not the subsequent column from wherever the previous group left off.
Notice, also, that “down then across” is slightly more complex code than “across then down”. When you need to figure out RowIndex first, as you do for “down then across” within a grouping level, you need to get a limiting factor of the number of rows, for that number of columns, that you are going to get for each group, so you know when to go to the next column. When you go “across first”, it doesn’t really matter how many rows there are in each group, or in the full set, for that matter. You just keep going to new rows until you run out.
NB: It’s entirely possible that, given a little more time to think about this, I could simplify the “down-then-across” version of this code yet again. Not gonna worry about that now.
In SQL, this extra complexity is easily handled directly within the query, using a temporary table, as I do in this example, or a joined query, CTE, etc. To a certain extent, we can do the same thing using multiple table vars, in DAX, as you’ll see. I’m going to highlight the Column and Row Index expressions in each version, because we’ll come back to them later.
-- across, then down:

select * ,
(ItemIndex - (ColumnIndex-1)) as RowIndex
from
(select *,
iif(ItemIndex % @Columns = 0, @Columns, ItemIndex % @Columns) as ColumnIndex
from (
 select (
          row_number() over ( partition by Continent
            order by Continent,country.Name,Language))   ItemIndex
        ,Continent as Continent
        ,country.Name as CountryName
        ,Language Language
        ,IsOfficial IsOfficial
        ,Percentage
      from world.dbo.countrylanguage
      join world.dbo.country on countrylanguage.CountryCode = country.code
where Language in (@Languages)
) x
) y


-----------------------------------------------------
-- down, then across:

select
count(*) as ContinentItems, Continent
into #ContinentItems
from world.dbo.countrylanguage
join world.dbo.country on countrylanguage.CountryCode = country.code
where Language in (@Languages)
group by Continent;

select y.*
, Ceiling(ItemIndex / ContinentRowCount )  as ColumnIndex
from
(
select x.*
,
 iif(ItemIndex % ContinentRowCount = 0, ContinentRowCount,
     ItemIndex % ContinentRowCount) as RowIndex
from

(select (
          row_number() over ( partition by country.Continent
            order by country.Name,Language))   ItemIndex  -- within a Continent
        ,country.Continent as Continent
        ,country.Name as CountryName
        ,Language as Language
        ,IsOfficial as IsOfficial
        ,Percentage
        ,(iif(ContinentItems   % @Columns  = 0, ContinentItems/@Columns,
         (Ceiling(ContinentItems/(@Columns * 1.00))) ) )
           as ContinentRowCount
        ,ContinentItems
      from world.dbo.countrylanguage
      join world.dbo.country on countrylanguage.CountryCode = country.code
      join #ContinentItems ci
      on country.continent = ci.continent
   where Language in (@Languages)
) x
)y
order by Continent, ItemIndex

drop table #ContinentItems;
3. Now for the DAX versions
I’ve added a new file to Spacefold Downloads, MSWorld2022.zip, which contains both a slightly-updated, scripted version of the MSWorld database and a PBIX with the three tables from the database imported into it.
At the bottom of this post, if you download my actual workfiles, you’ll find that I used a tabular model in SSAS, not the PBIX, as the source for my DAX queries, but I have verified that both will work, and you should be able to play along whichever way you choose.
I can get as far as an overall Row and Column Index in DAX. As you’ll see we build up in layers, adding the filter first so that all our numbers will respect it, and adding a “Key Value” next, which is basically a concatenated string of all the items that need to be “ordered” in the output.
Here’s the first section of the Across-then-Down version, which is what the OP needs:
DEFINE

VAR FilteredTable =
AddColumns(FILTER(
SUMMARIZECOLUMNS('CountryLanguage'[Language], 'CountryLanguage'[Percentage], 'CountryLanguage'[IsOfficial] ,CountryLanguage[CountryCode]
),
// your joined columns with filters in place
ContainsString(@LanguageList,CountryLanguage[Language])),
"CountryName",LookupValue('Country'[Name],Country[Code], CountryLanguage[CountryCode]),
"Continent",LookupValue(
'Country'[Continent],Country[Code],CountryLanguage[CountryCode])
)

VAR FilteredTableWithKey =
ADDColumns(
FilteredTable,
"KeyValue", CombineValues(":", [Continent]  , [CountryName], [Language]))
With our KeyValue in place as a convenience for ordering, debugging, etc, we can get an overall Item Index, remembering that we are not yet handling partitioning by Continent here:
VAR FilteredTableWithKeyAndIndex =
ADDCOLUMNS(
FilteredTableWithKey,
"ItemIndex", RANKX(FilteredTableWithKey,[KeyValue],,ASC,DENSE))
And now we can get a column index (again, this is an overall value, not a partitioned value):
// Get a  column index:
var TableWithColIndex =
AddColumns(FilteredTableWithKeyAndIndex,
"ColumnIndex",
if(MOD (RankX(FilteredTableWithKeyAndIndex, [ItemIndex], ,ASC,DENSE),
@Cols) = 0, @Cols,MOD
(RankX(FilteredTableWithKeyAndIndex, [ItemIndex], ,ASC,DENSE),@Cols)) )
And finally we can get a number of rows and a row index (again, overall). Here’s the last block, for our full dataset, ready to go into the exact same tablix as the SQL one if there is no row-grouping:
// get the number of rows based on the number of columns chosen and the filtered set
//-- * 1.00 as Q&D way to make sure we get the fraction,
//-- same as we did in the SQL version

VAR Rws = Calculate(Ceiling(CountRows(FilteredTableWithKey) * 1.00 / @Cols,1))

//Now add a Row Index based on this information

var TableWithBothIndexes =
AddColumns(TableWithColIndex,
"RowIndex",([ItemIndex] - ([ColumnIndex]-1)) )

Evaluate TableWithBothIndexes Order by [KeyValue]
I’m going to show the same code for Down-Then-Across here in one text block, because it’s really straightforward, and built up in the same sort of layers.
DEFINE VAR FilteredTable =
AddColumns(FILTER(
SUMMARIZECOLUMNS('CountryLanguage'[Language], 'CountryLanguage'[Percentage], 'CountryLanguage'[IsOfficial] ,CountryLanguage[CountryCode]
),
// your joined columns with filters in place
ContainsString(@LanguagesList,CountryLanguage[Language])),
"CountryName",
LookupValue('Country'[Name],Country[Code], CountryLanguage[CountryCode]),
"Continent",
LookupValue('Country'[Continent],Country[Code],CountryLanguage[CountryCode])
)

VAR ItemCount = CountRows(FilteredTable)

VAR RowCount = if(Mod(ItemCount,@Cols) = 0,
                  ItemCount / @Cols,
                  Ceiling(ItemCount/(@Cols * 1.00),1))
VAR FilteredTableWithKey =
ADDColumns(
FilteredTable,
"KeyValue", CombineValues(":", [Continent]  , [CountryName], [Language]))

VAR FilteredTableWithKeyAndIndex =
ADDCOLUMNS(
FilteredTableWithKey,
"ItemIndex", RANKX(FilteredTableWithKey,[KeyValue],,ASC,DENSE))

var TableWithRowIndex =
AddColumns(FilteredTableWithKeyAndIndex,
"RowIndex",
if(Mod([ItemIndex],RowCount) = 0, RowCount,
   Mod([ItemIndex],RowCount)))


var TableWithBothIndexes =
AddColumns(TableWithRowIndex,
"ColumnIndex",
Ceiling([ItemIndex]/ (RowCount * 1.00),1))

Evaluate TableWithBothIndexes Order by [KeyValue]
As you’ll see in the RDLs, in both versions, everything is ready to go for a no-code matrix control.
As long as there is no grouping.
So what happens with a grouping level?
I couldn’t (maybe you could? If so, please write and tell me how!) add this bit in to the DAX statement. I tried using report variables on a group level, but they couldn’t be used in a group expression, nor could I use aggregate functions such as RunningValue within the group expressions.
Here’s what did work:
- aggregate the values I need on a Continent group level, into a separate dataset.
- lookup those values within a group expression.
Here’s the code for the separate dataset (it’s the same for both snaking column styles). You’ll notice that it starts out exactly the same way as the “Main” DAX datasets, by getting a filtered set with a key and an index. Then it aggregates those values up to the Continent level for the lookups that we need:
DEFINE

VAR FilteredTable =
AddColumns(FILTER(
SUMMARIZECOLUMNS('CountryLanguage'[Language], 'CountryLanguage'[Percentage], 'CountryLanguage'[IsOfficial] ,CountryLanguage[CountryCode]
),
// your joined columns with filters in place
ContainsString(@LanguagesList,CountryLanguage[Language])),
"CountryName",LookupValue('Country'[Name],Country[Code], CountryLanguage[CountryCode]),
"Continent",LookupValue('Country'[Continent],
             Country[Code],CountryLanguage[CountryCode])
)

VAR ItemCount = CountRows(FilteredTable)

VAR RowCount = if(Mod(ItemCount,Cols) = 0,
                  ItemCount / Cols,
                  Ceiling(ItemCount/(Cols * 1.00),1))

VAR FilteredTableWithKey =
ADDColumns(
FilteredTable,
"KeyValue", CombineValues(":", [Continent]  , [CountryName], [Language]))

VAR FilteredTableWithKeyAndIndex =
ADDCOLUMNS(
FilteredTableWithKey,
"ItemIndex", RANKX(FilteredTableWithKey,[KeyValue],,ASC,DENSE))

var FilteredContinentStats =
AddColumns(GROUPBY(
FilteredTableWithKeyAndIndex,
[Continent],
"ContinentItems", CountX(CurrentGroup(),[KeyValue]),
"FirstContinentItem", MinX(CurrentGroup(), [ItemIndex]),
"LastContinentItem", MaxX(CurrentGroup(), [ItemIndex])
),
"ContinentRowCount",
if(Mod([ContinentItems], @Cols) = 0,[ContinentItems]/@Cols,
   Ceiling([ContinentItems]/(@Cols * 1.00),1)))

evaluate FilteredContinentStats
Here’s what the results look like:

With ContinentRowCount and FirstContinentItem in hand for each group, in this separate dataset, we have what we need.
Strictly speaking what we need are ContinentRowCount and ContinentItemIndex for each group. We take the overall ItemIndex we have in the main dataset already, and substract one less than FirstContinentItem, to arrive at ContinentItemIndex. I suppose I could have cleaned this up a little bit by subtracting the one and naming the value LastItemBeforeContinent, directly in the dataset, which would have made the resulting expressions in the RDL a little less clumsy. Oh well, I’ll leave that as an exercise for the graduate student.
Below, when you look at the group expressions for Rows and Columns that bring the contents of the Continent-level stats into the tablix, you might find the expressions alarmingly convoluted, at first. But that’s just the verbose Lookup syntax. If you look at each closely, you’ll see that it’s actually very similar the highlighted index expressions in SQL you looked at earlier. I’ll repeat that bit here, so that you can see it clearly.
Here’s the SQL for Column Indexes again:
-- Across-Then-Down version:
iif(ItemIndex % @Columns = 0,
@Columns,
ItemIndex % @Columns)

-- Down-Then-Across version:
Ceiling(ItemIndex  / ContinentRowCount )  as ColumnIndex
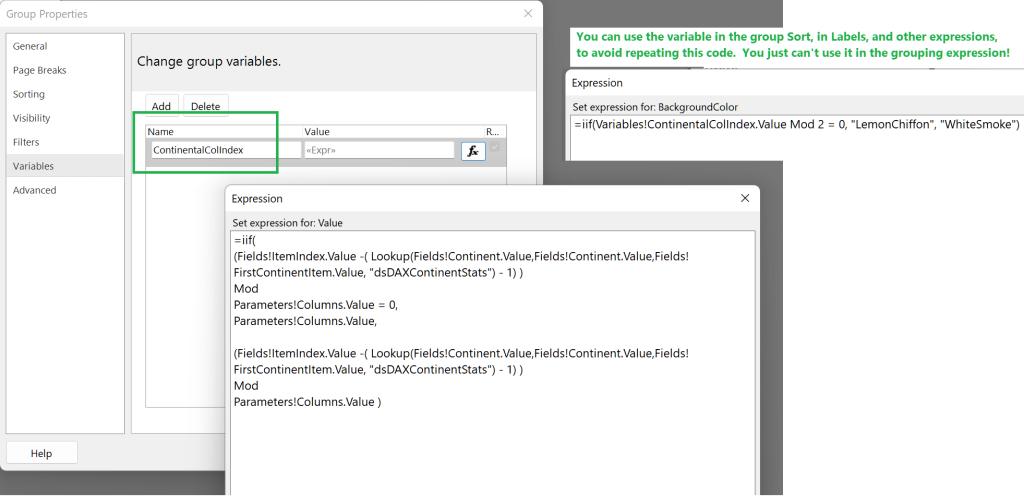
… compare those expressions to the Column group expression in both RDLs, and you’ll see that the red and blue elements in the RDL expressions are more complex, because of the lookup code, but the logic is otherwise exactly the same:
-- Across-Then-Down:
=iif(
(Fields!ItemIndex.Value -( Lookup(Fields!Continent.Value,Fields!Continent.Value,
Fields!FirstContinentItem.Value, "dsDAXContinentStats") - 1) )
Mod Parameters!Columns.Value = 0,
Parameters!Columns.Value,
(Fields!ItemIndex.Value -
( Lookup(Fields!Continent.Value,Fields!Continent.Value,
Fields!FirstContinentItem.Value, "dsDAXContinentStats") - 1) )
Mod Parameters!Columns.Value )

-- Down-Then-Across:

=Ceiling(
(Fields!ItemIndex.Value -
( Lookup(Fields!Continent.Value,Fields!Continent.Value,
Fields!FirstContinentItem.Value, "dsDAXContinentStats") - 1))
/ Lookup(Fields!Continent.Value, Fields!Continent.Value, Fields!ContinentRowCount.Value, "dsDAXContinentStats"))
Now let’s look at the Row Index expressions, again comparing the SQL to the RDL grouping versions.
In SQL, the Across-Then-Down version relies on the ColumnIndex previously calculated:
ItemIndex - (ColumnIndex-1)) as RowIndex— this is the Down-Then-Across version:
iif(ItemIndex % ContinentRowCount = 0,
       ContinentRowCount,
       ItemIndex % ContinentRowCount) as RowIndex
Here are the Row group expressions in the RDL, first again the Across-Then-Down version, which incorporates the ColumnIndex expression, this time by embedding it directly into the bulky expression, which is a PITA — maybe if I did this again I’d move the logic into Code.functions, rather than repeat it, considering that custom functions do seem to work okay in a group expression:
=
(Fields!ItemIndex.Value -( Lookup(Fields!Continent.Value,Fields!Continent.Value,
Fields!FirstContinentItem.Value, "dsDAXContinentStats") - 1) ) -
(iif(

(Fields!ItemIndex.Value -( Lookup(Fields!Continent.Value,Fields!Continent.Value,Fields!FirstContinentItem.Value, "dsDAXContinentStats") - 1) )
Mod
Parameters!Columns.Value = 0,
Parameters!Columns.Value,

 (Fields!ItemIndex.Value -
( Lookup(Fields!Continent.Value,Fields!Continent.Value,Fields!FirstContinentItem.Value, "dsDAXContinentStats") - 1) )
Mod
Parameters!Columns.Value )-1)
— this is the Down-Then-Across version:
=iif((Fields!ItemIndex.Value -
( Lookup(Fields!Continent.Value,Fields!Continent.Value,
Fields!FirstContinentItem.Value, "dsDAXContinentStats") - 1))

Mod Lookup(Fields!Continent.Value,Fields!Continent.Value,
Fields!ContinentRowCount.Value, "dsDAXContinentStats") = 0,

Lookup(Fields!Continent.Value,Fields!Continent.Value,
Fields!ContinentRowCount.Value,  "dsDAXContinentStats"),

(Fields!ItemIndex.Value -
( Lookup(Fields!Continent.Value,Fields!Continent.Value,
Fields!FirstContinentItem.Value, "dsDAXContinentStats") - 1))

 Mod Lookup(Fields!Continent.Value,Fields!Continent.Value,
Fields!ContinentRowCount.Value, "dsDAXContinentStats")
)
Not pretty?
Well, you can take some comfort in the fact that you can use group variables to avoid repeating this code, which you would otherwise have to do when providing a sort expression, or a label (such as the Column labels in my sample RDLs), a background color evaluation (here, I used one to provide alternate colors for columns), etc. As suggested above, custom functions might also make it more readable.

And you can also take comfort in knowing that it’s going to work without any adaptation if you change your number of columns, etc, because even with this added wrinkle for group level index values, the matrix control is being used the way it was designed to be used; no faking with “one column” tables each of which needs its own hard-coded filter expression, and which (sorry!!!) isn’t ever going to work with your group-and page breaks.
Oh, didn’t I say? page breaks seem to work fine in the method shown here. I can’t find a problem — if the OP does, they will weigh in and I will re-think.
So… you want the code?
I’ll add all the workfiles for this experiment (two .MSDAX files, two .SQL files, and two .RDLs, in a zip file here.
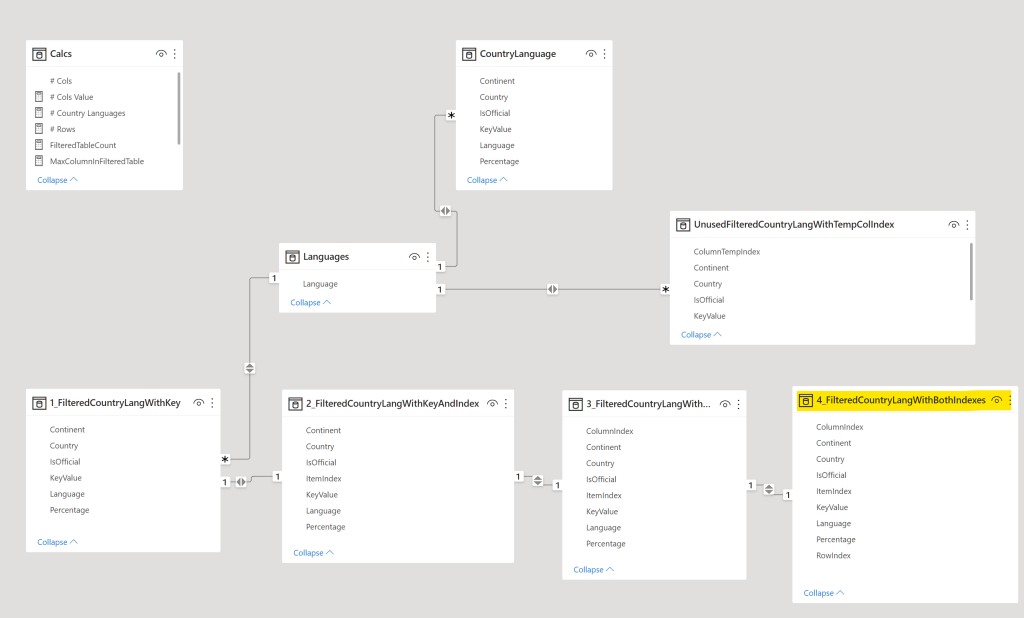
I also put the same DAX code into derived tables, directly in a PBIX, rather than putting the DAX into the RDL — just to satisfy myself that it would work the same way. I don’t know if it is of any value, though, because it doesn’t go that “extra mile” to handle the grouping, so I’ll omit that from the zip file. Honestly, it’s exactly the same code as the MSDAX text files.

Are we having fun yet?
I don’t think this is a particularly entertaining post to read, and it wasn’t amusing to write either. (I am sorry it’s so long.) On the other hand, I did find it somewhat rewarding to test the limits of this technique, and confirm that it holds up, for the most part, even when SQL is not available.
Are you out there? Can you help?
I’m also really hoping somebody in the DAX-centric world can give me a workable solution to using RANKX with partitioning. While I’ve seen numerous attempts to do this on the web, and believe me I have looked, because I need this all the time, in scenarios that have nothing to do with Snaking Columns, I haven’t found one yet that does what I want, reliably and dynamically.
Until I do… a little extra work in the RDL, which does work reliably and dynamically as far as I can tell, is worth it.