I should have known… I wrote a post about RLS with the idea that things could be vastly simplified if you created ONE role and put a bunch of logic in the rules for that role, rather than trying to create a bunch of roles with “simple logic” for each one, especially if some people were in multiple business domains, and therefore might fit into multiple roles with the original approach.
I should have known this would create another YAP situation: more thought, and more examples, would be required for additional cases.
In this particular case, my dataset used Import mode, and Brynn wrote to say that my code wouldn’t work with Direct Query, did I know what would?  I didn’t initially realize that the Role Management logic that I used, which checked additional tables for permission when allowing access to rows in the dimension tables, wouldn’t work in Direct Query mode, but they don’t.
![]()
… and, when you think about it, this limitation makes a crazy kind of sense. Because the Direct Query rows table are being pulled dynamically, and because which rows are allowed is dependent on Role rules, there is no good way to ensure that other tables’ contents have already been fully fetched (again, filtered according to RLS requirements). You could try to establish a sequence in a way that would work, but there would be no real guarantee that you didn’t end up with circular logic, and also means that multiple tables could never be fetched in parallel.
Mind you, I have never worked with the PowerBI or DAX teams directly, and am just imagining how this might have been thought about, when the limitation was put into place. I imagine similar discussions about why (for example) UserPrincipalName() and similar functions aren’t supported in logic for calculated columns and tables. Too much depends on exactly when something happens in relation to other stuff. I don’t envy them.
There are many other reasons why Direct Query is not always a good idea, unrelated to RLS limitations. There are obvious performance benefits to Import mode, with the tradeoffs being in cost/model size and potentially stale data. I wasn’t avoiding extra RLS complications intentionally when I wrote that post, I just hadn’t thought about it before… so, now I have.
FWIW I started with my .PBIX from the earlier walkthrough for this, saved it as a .PBIP, and just edited the “mode” information in each of the table’s *.TMDL files to get to a base state for this re-model. It seemed the easiest way. On editing the new .PBIP, I saw the error message you see above and got ready to roll up my sleeves.
Quick additional note on the Direct Query adaptation for the tables in this model: Because the model had three “special” sample entities not found in the World database (Person and the two cross reference tables for Person-Continent and Person-CountryLanguage), and because I didn’t want to cheat by leaving any tables in Import mode, no matter how sample-y, I just created SQL statements against the database for each one, like this (this is the Person version):
let
   Source = Sql.Database("Eden", "World",
   [Query=
   "select 'linich' as Login, 'Lisa' as DisplayName, 0 as AllContinents, 0 as AllLanguages
    union all
    select 'bob', 'Bob', 1,1
    union all
    select 'carlos', 'Carlos',0,0;"])
in
   Source
Back to the Simple Case
If all you want to do is follow my original plan of having only one Role, and if you don’t have any complex scenarios involving edge cases of “who can see what”, it’s actually a pretty easy change.
- Remove the relationships between Person and the two cross reference tables.
- Set the xRefPerson* tables’ relationships to their respective “main” tables so that the cross reference filters the main table.
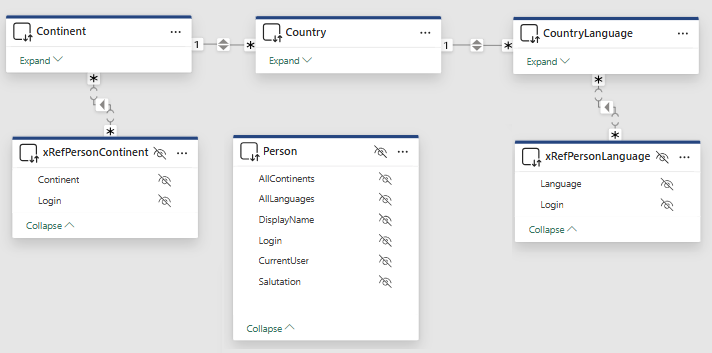
- Person is still limited with an RLS rule (Person[Login] = [CurrentUser]) but now that rule isn’t really affecting anything except the “Greeting” textbox.
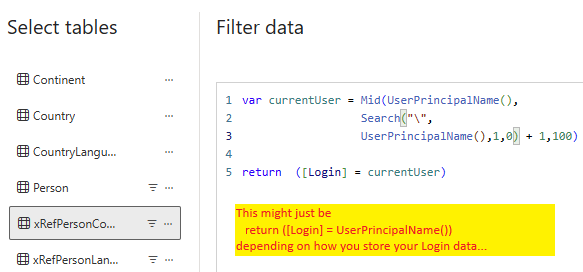
- The two cross reference tables’ RLS rules are simplified as shown in the next image — they each just compare their row’s Login value with the current User — and they no longer reference any other tables.
… and believe it or not everything just works. I would totally still go for this approach versus multiple roles.
I suppose I could have put a measure in each, with the same logic as [CurrentUser], so you didn’t see the parsing in the RLS rule, but I don’t see what it would buy me, frankly, so I just parsed out the value in a var right there. I didn’t do any timing checks or try to figure out whether the evaluation is done more frugally as a measure. I’ll look forward to seeing what somebody else (who has a big-enough cross reference table for it to matter) contributes. Either way, it’s kinda trivial to implement.
With the RLS rules against the cross reference tables, not the main tables, it’s trivial. So why didn’t I do it that way the first time?
Real-Life (Complex) Case
What happens when you have a problem that requires looking at other tables and making complex evaluation for a user’s status with respect to a row? After all, that is why I was looking at other tables previously.
In my earlier walkthrough, I modeled this situation using a couple of boolean values in the Person table to signify that somebody was permitted to see “all languages” and/or “all continents”, even though that person had no rows in the cross reference table. The (plausible) rationale was as follows: why should an admin have to populate those rows, and also possibly update with new ones every time new languages were added?
In Import mode, I could check the Person table and look at the relevant boolean flag to see if I should return “true()” even if there were no rows in the cross reference table. I could also return “true()” by checking to see if there were rows in the cross reference table, even though I couldn’t use the cross reference to filter the main table (because of the missing “all…” rows).
It turns out not to be that difficult to handle this in Direct Query mode, too. I just needed to suck it up.
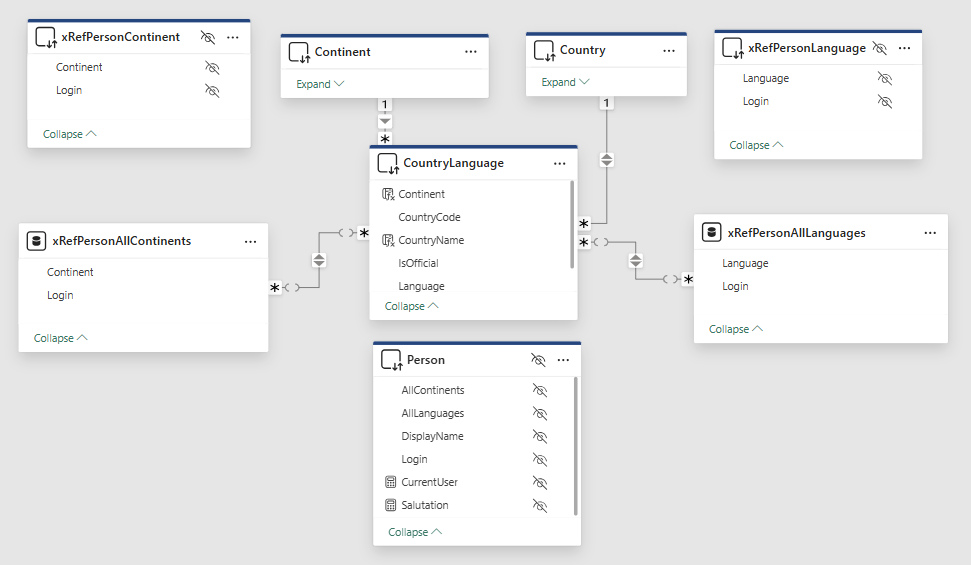
The key is that you do need to create a virtual cross reference table that gives you what you need, regardless of what that might be, holding all the rows you might need for every user. You have to do this the more-standard PBI data model way.
If your rules for user permissions are particularly complex, you might want to do this by creating a view or even a table-valued function (yes, you can get a Power BI table from a TVF, using code similar to the “dummy” code I show for Person above, and even pass it some params, within limits). For my example, I handled the creation of the virtual set directly in DAX, as follows — this is the Continents version:
xRefPersonAllContinents =
UNION (
    CROSSJOIN (
        SUMMARIZECOLUMNS (
            Person[Login],
            ( CALCULATETABLE ( Person, Person[AllContinents] = 1 ) )
        ),
        Continent
    ),
    xRefPersonContinent
))
The CountryLanguage is a little more complicated; where you see Continent above, you’d see
SUMMARIZECOLUMNS ( CountryLanguage[Language], CountryLanguage )
… because the World model is a bit screwy and there is no table with unique Language values .
The basic logic, for my sample scenario, is to union a cartesian-join-set of “all users who have the rights to see all Continents [or Languages])” with “all Continents [or Languages]”, with “all users already in the cross reference table assigned to specific Continents [or Languages]”. But the exact query is going to be different for each set of business requirements that you might have.
Your business requirements may be that “Salespeople can only see their own Sales Orders. Heads of business units can see all of their own Sales Orders, plus those of their direct or indirect reports. Everybody in the Finance Dept can see all Sales Orders except those written by anybody with the title Vice President. The VP of Finance and the President and members of the Billing Dept can see everybody’s Sales Orders, but only if they are Closed. The Comptroller can only see Sales Orders on the last day of every month.” I really don’t care.
What about that all-important situation of people who have more than one business function? Generally (from experience) their allowed-row-sets will be additive, so a UNION of sets, each based on one of your rules, will probably take care of it. In the smaller realm of cases where two of your rules might conflict for a certain user, you’re still going to need to come up with the proper logic to resolve the problem, somehow. But you can do it.
No matter what your logic — this is key — you are getting the full set, not a set filtered for RLS requirements and the current user, in our virtual cross reference, so there isn’t any need to pass context or login information to the TVF, if you’re using one.
Yes, it might be non-trivial to get the virtual cross reference/full set. I don’t know your business rules. But it has to be possible, somehow, to evaluate what rules each user is allowed to see and present that as a table, typically holding Login and primary key of the business entity to be filtered (in our case, Continent or Language) and nothing else.
And once you have this full set of cross reference rows, the problem is back to being trivial. We remove any relationships and the RLS rules for the original two xRef tables, and put the relationships against the two new, all-inclusive, virtual xRef tables, because they can now filter the main tables as expected.
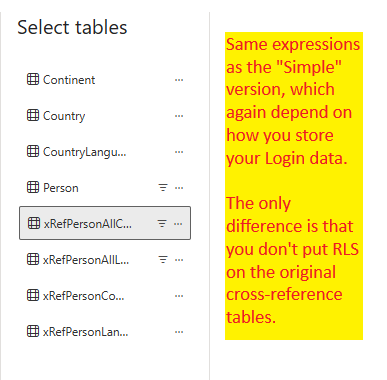
We use the same simple logic for RLS for each of the two new tables that we did before, whatever that was, depending on how you store your Login values…
… and everything works as you’d want it to. Frankly, it feels a bit cleaner than the extra hoops I used in my original version with Import mode — and I’m sure this version would work in Import mode, too.
I didn’t want to add the phantom rows. But I think it was the correct decision, all things considered.
And there’s still only one role, very simple to write, and much simpler to assign users to.
Oh, all right. |
|
| If you look at the data model I used for this scenario, you’ll see it’s back to being a vanilla star schema, not anything complex, just the way Power BI “prefers” things. I got tired of dealing with the weird-ass World schema’s CountryLanguage table as any way besides the hub of a star, when it had really nothing to do with the RLS technique I was trying to illustrate.
|
 |
I’m pretty sure PBI developers — “real” ones, who do this every day, as opposed to very-occasionally in the midst of dealing with other technologies — walk around muttering to themselves “whatever works, whatever works”. In fact, I’ve seen them do it, and not be ashamed at all. I’m only surprised that they don’t admit the actual mantra is probably “whatever works TODAY/this version”.