Chris wrote with the following intriguing question.
Lisa,
Hi…I’ve been scouring the web to find out how to force ssrs to insert a blank page when a group ends on an odd numbered page thus allowing the next group to start on an odd numbered page. This will allow us to print a large collection of reports double sided and guarantee that each group starts on the front of a new page. You seem to have a great deal of experience and expertise. Could you offer any suggestions?
Thanks, Chris
Well, I may have a lot of experience, but none of it suggests that this is going to be an easy task.
The problem with any question involving page breaks is that you have to consider (at least) the following potential dealbreakers:
- Renderer differences. First, you may not even want the same behavior from one renderer to the next, or you may not want it when the report is running in the browser. For example, in Chris’ case, he probably doesn’t want this behavior if the report is exported to Excel. Second, if you need to evaluate the number of pages per group in some mechanical manner — as I was forced to do here — each renderer may have its own rules for white space, page margins, etc.
In Chris’ case, we need to get this to work when it’s printed interactively. I’m not sure my solution will work without some information about printable area on different printers’ pages, but that might be handleable, depending on environment. He also wants the behavior if the PDF output is printed, which does seems reasonable… but as everybody knows the PDF renderer has a pesky habit of changing the available space on the page from what you might expect.
- Version differences with respect to our old friends Order O. Evaluation and his kissing cousin Sequence O. Execution. Regardless of when you want to force a page break, if you involve any custom behavior or code, it’s liable not to work the same way from version to version, as the RS gods attempt to optimize RDL behavior further. This goes double for code that also must work across multiple renderers, because anything involving page headers and footers will be handled separately by each renderer, as fits its needs, from the handling of the body collection.
In Chris’ case, he’s using 2008 R2. Several tried-and-true methods I’ve used before to force a page break, using a special group that called some custom code, just didn’t work. I’m not sure why and frankly am just not in the mood to figure out what exactly is different now.
I struggled with this for several hours.
Why bother? What’s the excitement?
I might not have been intrigued with this question except that R2 really does offer a couple of neat new features that looked like they might help, sorta. I don’t mean the new reset pages for groups, although somebody else might figure out a way they’re handy here (I couldn’t).
Let’s get started, and you’ll see.
Setup
Further questions revealed that Chris’ report has an outer group on Students with a pagebreak, and an inner group on Classes, which does not pagebreak. The Classes’ details list assessments and scores. Maybe this is a Gradebook application or similar; I hope he’s not working for one of the vendors I have to deal with at work <sigh>.
I’ll mock up the data using a simple query with my usual MySQL World tutorial data:
SELECT Continent AS Student,
Region AS Class,
Name AS Assignment,
SurfaceArea AS Score
FROM Country
ORDER BY Student, Class, Assignment
My sample report is also very simple (read on– I’m not sure how far you are going to be able to “stretch” this solution beyond a simple report, although more than this is definitely possible):
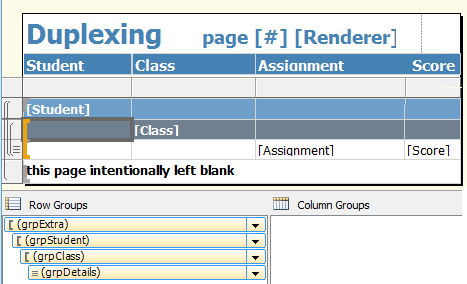
The grpStudent group is the “real” group. It’s got the pagebreak at end that we always want.
As you can see, I’ve got an extra group outside the “real” Student group. It’s got a pagebreak at end also, we just need to figure out how to eliminate it for the groups that don’t need it because they have an even number of pages.
Originally I thought I would do this the same way I have in the past, with a dynamic group break using a UDF. In R2, after some gnashing of teeth and the first couple of hours, I just couldn’t get this to work. Instead of a UDF, I grouped on the same Student value and used the first of those cool new R2 features that looked so intriguing:
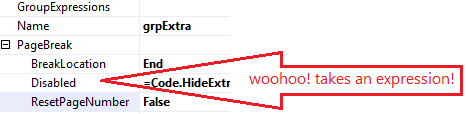
Obviously this new capabiility is going to suppress only the pagebreak, not the entire extra group the way my dynamic group break expression would have done. So, with this technique we’ll also need to suppress the group footer row (shown in my sample with the clever “this page intentionally left blank” textbox) whenever we don’t need it. Otherwise, that group footer line would show up adjacent to the subsequent group.
The good news is that we’ll be able to use exactly the same logic, in the Row Visibility expression, to hide the group footer row with the textbox, that we use in the PageBreak Disabled expression.
Now, about that logic
Here comes the really ugly part.
I haven’t been able to figure out a way to use those tempting TotalPages values, reset on group, successfully for this purpose. I did try. Instead, I’ll have to brute-force the evaluation.
The determination comes down to something like this:
Using either a row count or a page height, and evaluating the contents of this group, how many pages does this group take?
The required elements are going to be as follows:
- how many inner groups (in Chris’ case, Classes) does this outer group (here, Students) have? How many rows of group header and footer information will each of these inner groups have, and how much space will they take up?
- how many detail elements (in Chris’ case, Assessments or Assignments and their Scores) are there in this outer group, total? How much space will they take up?
- how many rows are needed to express the outer group’s headers and footers? How much space will they take up for the group?
- how much room is there on each report page ?
Each of these elements can be expressed as a RowCount or as a Height. If you’re using RowCount, as I am to keep the example simple, you will need to either figure fractional rows to handle rows of different heights (for example, a Class header with a different font), or (as I did in this sample report for simplicity), make all rows the same height. (Fractional rows is not a difficult, or even a wacky idea. Don’t be afraid to try it.)
I’m sure you can spot the biggest limitation of this whole approach: I’m not accounting for rows that can grow or shrink.
MAYBE it’s possible to do this with code that feeds a code array with textbox heights over the course of the report, but based on my R2 experiments so far, I am not optimistic. I just turned off CanGrow for all the table rows, and left it at that, for now.
I’m not as sure you’ll spot another potential difficulty, that we can actually take care of: my final required item is the number of rows, or height available, on a report page, but this is something that changes from renderer to renderer. Here’s where another one of the exciting new features of R2 comes in:
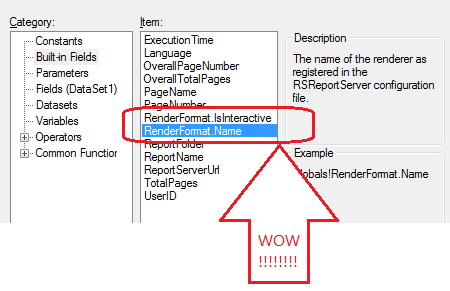
Wow! We have access to this information! I don’t have to kludge this anymore! I was so exited about this that I included the RenderFormat.Name value in the header of the report, as you can see in the first screenshot above.
So, with that exciting news, and keeping in mind the values we need to calculate, we can use the following expression in both the PageBreak. Disabled expression and the Row.Visibility.Hidden expression (for the extra group footer), passing in what the report can tell us at runtime:
=Code.HideExtraGroup(
Globals!RenderFormat.Name,
Globals!RenderFormat.IsInteractive,
CountDistinct(Fields!Class.Value, “grpExtra”),
Count(Fields!Assignment.Value,“grpExtra”))
… and we’re going to feed that expression to a function with a method signature that looks like this:
Function HideExtraGroup( _
RenderType As String, IsInteractive As Boolean, _
InnerGroupCnt As Integer, GroupDetailCnt As Integer ) As Boolean
Now we need to use that information to evaluate each group.
There is at least one element that we should be able to declare once, for every group: that is the count of rows (or amount of space) required by the header(s) and footer(s) for grpStudent. I’ll indicate that by declaring a variable I can use in the rest of my calculations. The value is 1 because (a) I’m counting rows, not measuring height, and (b) I only have one header row for each Student, and no footer rows:
Dim OuterGroupHeaderAndFooterRowCount as Integer =1
‘ this would be a static height value, instead of static row count,
‘ if we were working that way for the other values
The actual code in the HideExtraGroup implementation I’ll provide is pretty trivial, but it shows you all the elements you need to get the job done:
Function HideExtraGroup( _
RenderType As String, IsInteractive As Boolean, _
InnerGroupCnt As Integer, GroupDetailCnt As Integer ) As Boolean
‘ TBD: Should IsInteractive or some renderer types
‘ automatically return True?
‘ should Excel renderer automatically return True, to avoid extra blank sheets?
Dim countRowsInGroup as Integer = _
InnerGroupCnt + GroupDetailCnt + _
OuterGroupHeaderAndFooterRowCount
‘ this is a very simple version of the calculation needed,
‘ but it’s okay for my simple report, which has only
‘ one header row (and no footer rows) for each inner group,
‘ and one detail row for each detail item.
‘ If yours has more, perform some additional multiplications
‘ before arriving at this value.
Dim countRowsPerPage as Integer = _
GetRowsOnPage(RenderType, IsInteractive)
‘ This function stubbed in appropriately for my report, below.
Dim pagesPerGroup as Integer = _
Ceiling(countRowsInGroup/countRowsPerPage)
Return (pagesPerGroup Mod 2 =0)
End Function
Function GetRowsOnPage( RenderType As String, IsInteractive As Boolean) As Integer
Return 39
‘ Refine this with renderer type as needed, and
‘ add interactive calcs also if really needed
‘ — the actual value for each renderer is going to be
‘ different for every report layout, obviously.
‘ As with the other calculations, you can do this
‘ in heights rather than row counts if it makes sense
‘ for your layout.
End Function
Well.
Here’s Duplexing.pdf (145.76 kb), an example of my output (again, using MySQL World to “stand in” for Students and the other values). I’m sure this solution isn’t going to suit every case, but it will suit some. If Chris really does work for one of the Gradebook vendors I deal with, it would actually be fine for their reports, which are (to say the most) pedestrian in layout.
Chris may weigh in here with questions or additional requirements, or you might.
And I’ll go back to scratching my head about what doesn’t work the same way in R2 when I have a chance.
Meanwhile, I am chuffed about those new RDL features R2 gave us to play with. Aren’t you?
Some more to be done with them, I’m sure.