Last week, I told you about my recent discovery of a good reason to use group variables in SSRS. The requirement seemed simple, obvious, and could be given to you any time.
This week, I’ll tell you about another standard scenario that really bugs me, and comes up pretty often, and how the Word renderer helped me resolve it.
I’m calling this a “standard scenario”, not a “requirement”, for a reason. Here’s what happened to me — and I bet it happens to you, too:
I had already fulfilled the requirements, and then somebody wanted to repurpose the report by analyzing the results in Excel, and had a minor anxiety attack.
You don’t recognize this scenario, you say? I bet you will, once I illustrate it.
Here’s how it was
To illustrate, let’s take the following simple query (from my standard MS-SQL implementation of the MySQL World tutorial database):
SELECT
RTRIM(City.Name) AS CityName,
City.Population,
RTRIM(Country.Name) AS CountryName,
Country.Continent
FROM
SQLWorld.dbo.City INNER JOIN
SQLWorld.dbo.Country ON City.CountryCode = Country.Code
… We’ll express this as a simple table, grouped on Continent, and grouped within Continent by Country. We want to see Country populations as a total line for each Country group, and then be able to drill down into City details as needed. What could be more obvious?
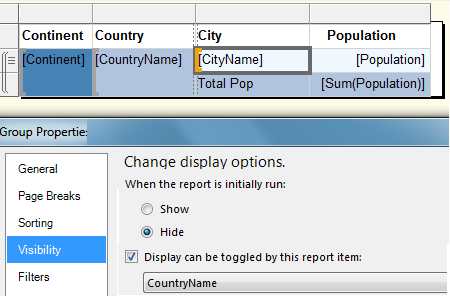
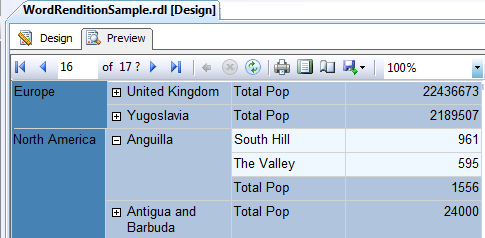
Okay, okay, the real report is more complex, sure, but this is the basic idea: Look at the aggregate, then optionally drill down to the details. That’s all.
So what’s the problem?
The first time a user decides to try the “Export to Excel” feature, they find out that they can’t easily sort by country population, filter by country, et cetera, because the Excel renderer preserves this report layout as outline levels.
You may not be able to see the cities because the rows are hidden, but they’re there, and they’re interfering with what looked like an “obvious” extension use case for the original report.
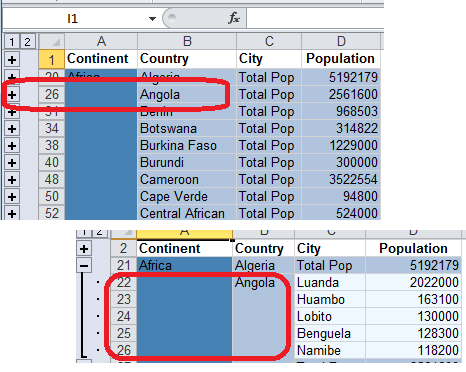
The user in question was None Too Pleased.
There now. Are you sure this has never happened to you?
If it were really a simple report, it might be easy to create an aggregated version of the original report and export it without the detail lines, either as a simpler RDL or even as CSV. Do this additional query-plus-export to give this user a chance to analyze the data in Excel to his heart’s content. But it’s not really a simple report, is it?
In this case there happens to have been a lot of code and arrays that apply business logic both across and down, which create the subtotal results. They’re not really coming from the database at all, and it would be very difficult for them to be derived from straight SQL. This part may or may not have happened to you, and it’s not really relevant. You have a report, it has collapse and expand set, you’ve already put a lot of work into this report, and you’re not responsible for the hash that the Excel renderer makes of it.
The fact is that the Excel renderer, while not exactly as dumb as a box of rocks, only fulfills one out of many reasons why people might want Excel exported a report. The requirement it fulfills is: give me something that looks like the fancy layout of the original report. The requirement it does not fulfill is: give me something that will function well for additional manipulation in Excel.
The designers couldn’t do both, and they chose faithful reproduction of RDL appearance. They made a judgement call, and a reasonable one — I’ll explain why I think this, below, but I shouldn’t really have to explain and give you an alternative. Just imagine for a minute that the designers hadn’t made this choice. Now imagine what early reviewers would have said when the Excel export didn’t look like the RDL result. Now imagine what the designers’ bosses would have thought of their design choice.
Oh my Word, what a rendition
Guess what? The Word renderer reproduces the collapsed layout more faithfully than Excel. If you leave everything collapsed in the Report Viewer interface when you Export to Word, you don’t get the detail. You get a Word table that looks like this:
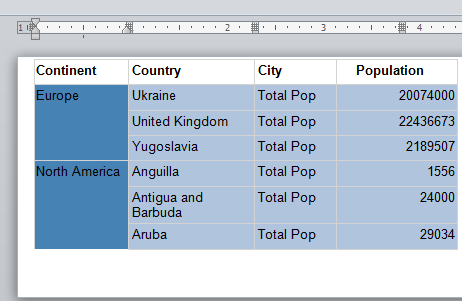
That doesn’t immediately solve all your problems, unfortunately. The Word renderer may not look like it’s dumb as a box of rocks, but it really is. Sure, this is a table, and sure tables in Word can be sorted, etc. Just try it.
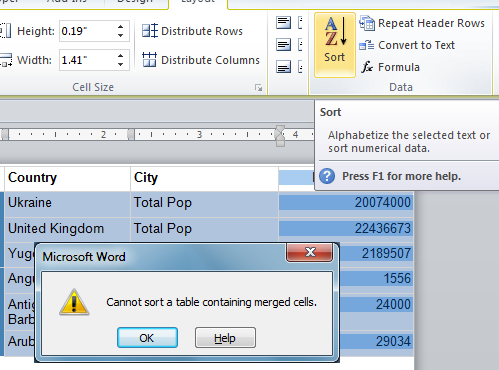
Uh-oh. Well, NBD. They didn’t really want simple Word table tools anyway, right? They wanted all the nifty data-manipulation of Excel. So here is what you do:
-
1 – Export to Word, see above. Assuming all groups are collapsed to start with, this gets rid of the detail rows, without going through manual or macro-driven work in Excel.
-
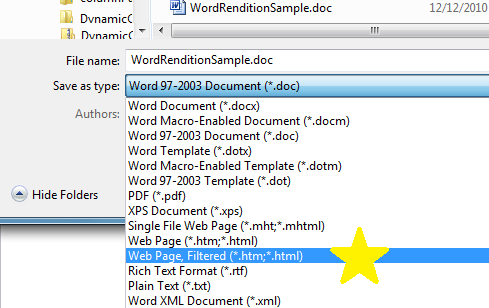
2 – Save the Word document As Filtered HTML. This will give you a relatively “cleansed” (compared to regular Word HTML) version of the output.
-
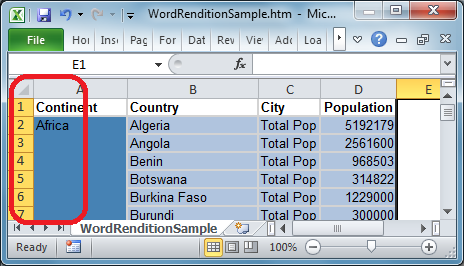
3 – Close the HTML document in Word… and open it in Excel.
-
4 – This new version will open as a simple table, without hidden or merged cells, ready for analysis. In my experience, it even tends to have fewer datatype problems than the “official” Excel export.
YAPS: What’s the right solution?
Well, it works. It kind of makes my skin crawl, but it works with the SSRS-native tools and actually gives me a reason to use the Word renderer in a pinch. Never saw that one coming.
I didn’t have much time and much user patience left, on this occasion. I was honestly more interested in defending the ability of “native SSRS” to do a good job than in showing how a little custom code made all the difference. Some people think that, if you have to write anything custom, the tool itself is a failure. That’s hardly true, but I wasn’t in a position to argue at that moment.
Here’s the argument I’d like to make, to you: The reason the designers could make the decision to have the Excel renderer handle the physical layout of the RDL as faithfully as possible is… drum roll… we can always get any Excel we want.
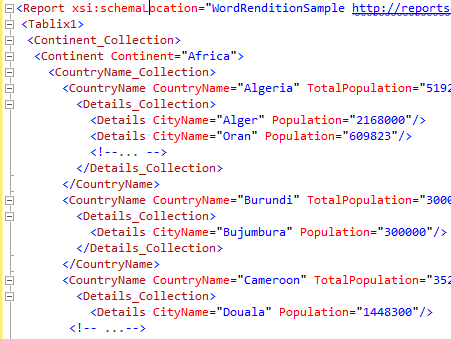
We have the XML renderer, after all. It doesn’t care about presentation; it gives us the result of the RDL’s calculations (including all my arrays and custom business logic in the real report here).
No matter how complex the inner workings of the report, and no matter how tortured the original RDL presentation, the XML output of an RDL is always pretty clear. Group levels are presented beautifully, simply, like this:
… and XSLT to parse out the summary details for each country, while ignoring the details, is never going to be more complicated than this (I’ve added a tiny bit of complexity to this version to try to make it extra-generic for you):
<?xml version=‘1.0‘?>
<xsl:stylesheet version=“1.0“ xmlns:xsl=“http://www.w3.org/1999/XSL/Transform“>
<xsl:output encoding=“utf-8“ method=“html“/>
<xsl:param name=“LevelsDown“ select=“6“/>
<xsl:template match=“/“>
<table>
<tr><th>Continent</th><th>Country</th><th>Total Pop</th></tr>
<xsl:apply-templates
select=“//*[count(ancestor-or-self::*) = $LevelsDown]“/>
<!– doing it this way to suit however many nested details
you might have in your version, instead of some
explicit statement like
<xsl:apply-templates select=”/*/*/*/*”/>
–>
</table>
</xsl:template>
<xsl:template match=“*“>
<tr>
<td> <xsl:value-of select=“../../@*“/> </td>
<td> <xsl:value-of select=“./@*[1]“/> </td>
<td> <xsl:value-of select=“./@*[2]“/> </td>
</tr>
</xsl:template>
</xsl:stylesheet>
…. as you can see, I’m not even bothering to create SSML here. All we need is a simple table for Excel to consume, just as Word produced. HTML output is going to do find, and it is dead simple to produce in XSLT.
I’ve shown you in other posts how to attach the XSLT directly to the RDL if you want this result directly from Report Manager, although that’s hardly the sticking poiint for most people, and how to do more when you’re ready .
I am entirely sick of hearing that XSLT is “too much of a learning curve”, from the exact same people who are currently extolling the virtues of other functional languages — learning curve or no — to the skies.
That’s right, people. XSLT is a declarative, functional language. Complete with immutable variables, no side effects, the works. Just get over yourselves and get some of this goodness working with your reporting implementations.