Moki turned out to be a bona fide word in a few languages (Maori?!?) but was really just a mashup of “amok” and “Loki” that came out of nowhere, just like him.
We will probably never know his true name. He will certainly never tell us.
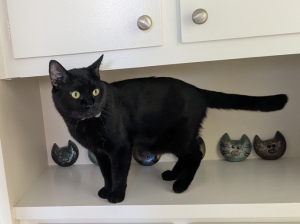
A previous attempt at adoption (he has a rather, ahem, chequered past) pegged him as Mischa. At Marin Humane Society, they called him Mission. We have no idea what his mission could have been, and he’s not likely to divulge that, either. He looks like a black cat who slid on his belly through a bit of white paint. Maybe that happened while he was on mission.
He is, in all significant ways, the anti-Buster.
The inner Buster was a tiny, needy, unable-to-fend-for-himself, loving, cuddly baby kitten. Somehow he presented as a huge, majestic, regal panther who ruled the entire world while remaining inexplicably attuned to our every mood and motion…
And Moki?
Moki manifests as an animé baby who needs your protection. But internally he is a self-contained, self-reliant, self-centered and indefinably competent beast who only occasionally tolerates any engagement, and after a few moments is too busy to notice us *.
When it comes to showing affection, he seems to follow the precept to “always leave them wanting more”, like many a great showman.
What to do? How to respond? We’ll just love him.
It’s said that the Cat Distribution System gives you the cats you need and deserve. I don’t know about that, but we feel pretty lucky when he shows us he knows we’re his Home. Bemused, but lucky.
* His schedule is quite regular, and important to him, and looks something like this:
- wee hours: marauding (Loki Time), he doesn’t tell us what or where or why. Sometimes there are toys all over the house when we get up.
- approx. 7 am: he slams in and settles on our bed for a quick doze after which he awaits breakfast quite patiently; Moki is not obviously food-driven, unlike all our other cats.
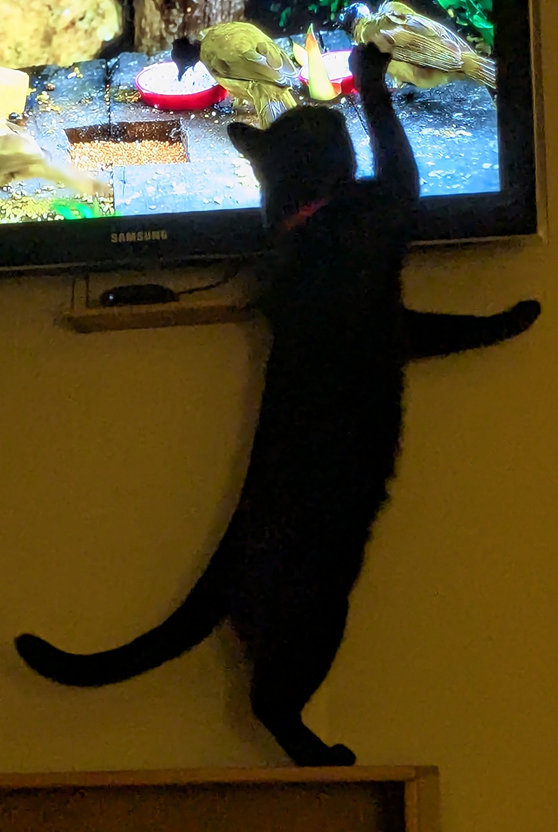
- approx. 9 am: he’s all about zoomies and rushing about (Amok Time).
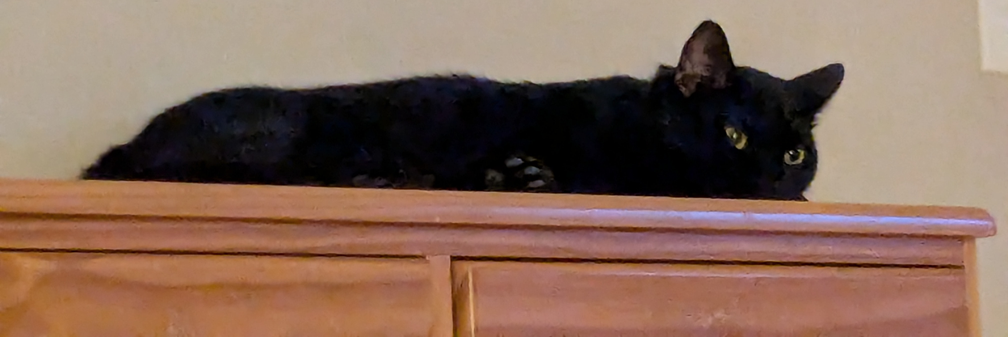
- late morning, early afternoon: there’s some serious snooze action (Low-key Time?).
- 4 pm-ish: he starts agitating for dinner, but if nothing happens immediately, he marauds some more.
- after dinner and a bit of capering about, it’s evening visiting hours in the Human Zoo: for about a half hour, he deigns to accompany us as a fellow couch potato.
- bed time: he sits in box-against-the-wall for a self-designated period. Usually this ends with a quick game of Pounce-The-Foot. Then comes a short burst of snuggle-time, during which he is intently busy making murder biscuits with those tiny, lethal paws.