C&L Nicholls - Spacefold Lisa's Page >L<'s Fox Stuff FoxSpoken Volume Index
© Lisa Slater Nicholls, Acxiom Corporation
This revision includes change through VFP 6 SP3, May 1999. For some additional capabilities in the Coverage engine and application available starting in VFP 7, read this article on VFP and XML.
Summary: Provides an in-depth look at the Microsoft® Visual FoxPro® Coverage Profiler. (30 printed pages)
Click to copy the sample files discussed in this article.
If you've ever SET COVERAGE TO <logfile name> in Visual FoxPro and then looked at the results, you know that this text file needs some form of organization before you can make sense of it. The Coverage Profiler provides one good way to organize and understand the coverage log generated by Visual FoxPro.
As you test your applications, however, you ask many different kinds of questions. Buried in the coverage log is data containing answers -- but there will never be one interface, or one method of analysis, that answers all these questions. That's why the Coverage Profiler is designed to make alterations and extensions easy.
When you want a subtle enhancement to its existing features, you can tweak the Coverage Profiler shipping interface. Look deeper and you'll find the Profiler has laid out the coverage log information in tables you can query and display to match any development strategy.
This article will take you on a narrative journey, a path you might take as you discover your own requirements and explore the Coverage Profiler's abilities to satisfy them. We'll tackle some real-life issues, building new and enhanced sample Profilers as we go. No specific example in this article may address your particular needs, but each example will teach you flexible techniques.
Without a sense of "something missing" it's difficult to go forward enhancing or altering any application. For the fictitious journey you'll take in this article, you'll begin by noting a few things you'd like to change in the Profiler.
You have probably noticed that just a few moments of testing in your applications can create huge text logs, and the temporary tables created by the Coverage Profiler are larger still. It takes large amounts of time for all this work to be done, not to mention huge chunks of disk space.
You decide, therefore, to explore ways to limit the time and disk space required by Profiler operations.
You realize that, without help, the Profiler has no idea you are only interested in testing some of your code. It indiscriminately analyzes the entire log. If you can limit the log, or teach the Profiler what parts of it are important, you may be able to achieve your goals.
You think it may be best to limit the log simply by toggling SET COVERAGE between TO <file name> ADDITIVE and TO <nothing>. This approach doesn't require changing the Profiler at all, but it has several disadvantages; it interferes with getting realistic Profiler times and it is clumsy to manage. Either you set breakpoints interactively to SET COVERAGE (making automated testing impossible) or you need to instrument your code by placing these instructions within your programs and methods at appropriate points. Instrumenting code does not necessarily lead to inefficient programs at run time, especially if you use #IF constructs to limit the SET COVERAGE lines to debug versions of your application. However, the practice of instrumenting has a fairly high development-time penalty.
After a few attempts, you conclude that it is better to SET COVERAGE once and let the internal logging go on its merry way, but make the Profiler smarter about how it works on the log.
Note We're about to start our exploration of the tools and methods you can use to adapt the Profiler. You'll find all the examples here available in the source code for this article. The examples consist of .prg files, some supporting .bmp and .msk files, and one visual class library (COVNEW.VCX).
Before exploring these examples, you will need to unpack the Coverage source folder from XSOURCE.ZIP, which you'll find in the Visual FoxPro HOME( )+ Tools\Xsource folder. Once you've unpacked the Coverage source, you'll be able to modify the visual classes. Sometimes the Class Designer will ask you to locate a parent class when you attempt to modify a class in COVNEW.VCX. In all such cases, you'll find the required classes in COVERAGE.VCX, which is part of the original Coverage source. Point the COVNEW.VCX classes to COVERAGE.VCX, wherever you unpacked it from XSOURCE.ZIP.
You begin by exploring the working parts in the default Profiler to learn how you can best adapt them.
Invoke the Coverage Profiler normally (from the Tools menu or by using
the command DO (_COVERAGE) in
the Command window). If the Profiler starts up in the separate Coverage frame,
click back to the main Visual FoxPro window.
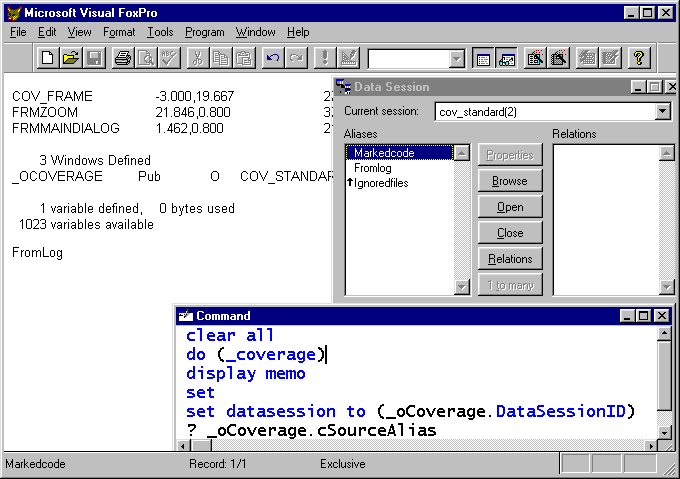
While the Profiler is active, DISPLAY MEMO
from the Command window. You'll notice a public variable _oCoverage,
of class cov_Standard, in the list (see Figure 1). This is the automatic
public reference to the Profiler. You can put this reference variable in the
Visual FoxPro Debugger Watch window to examine the exposed Profiler properties.
You can also use the reference variable to call individual Profiler methods
interactively.
Note An add-in is similar to using this reference variable interactively, except that it allows you to perform a series of connected actions in a sequence. Like any other program, an add-in allows you to execute a sequence more than once without having to think about the individual steps. Typically, an add-in involves running several Profiler actions, along with some additional code that you write. Add-ins are a convenient way of attaching code to the Profiler, or having an effect on the Profiler attributes, without adding or editing Profiler methods.
You're ready for some interactive experiments. You loaded a log file when you started the Coverage Log (otherwise the Profiler would have failed to start). Even so, when you bring up the DataSession window, it appears empty at first. Type the following in the Command window:
SET DATASESSION TO (_oCoverage.DataSessionID)
You now see a data session with the initial set of Profiler workfiles. As shown in Figure 1, there's a cursor with the alias IgnoredFiles. This cursor only holds the private list of Profiler source files, so it doesn't analyze its own startup procedures if they appear in the log. (If you wrote a subclass that performed very early startup procedures, your subclass could add more file names to this cursor.)

Figure 1. The standard Profiler has a public reference variable and a private data session.
You'll see two more aliases: FromLog and MarkedCode. These are the default aliases for two workfiles we'll refer to as the Coverage source and target cursors throughout this document. You can check their default aliases using the Profiler cSourceAlias and cTargetAlias properties, at any time -- but actually, the source and target cursors can have any alias you like. You'll see why this is important in one of our final examples.
Although you'll notice the Profiler generating some additional files as it works, its source and target are the two cursors you'll use the most. You can browse them now to get acquainted with their contents. Notice that the source cursor holds one line for every executed line of code in the text log, while the target cursor organizes this information by file and object.
Thinking about your goals (limiting time and disk space), you start to see lots of places you can make some changes before you write any code. For example, both the source and target files use some long character fields. You can shorten the lengths of these fields using three properties matching the field names: iLenHostfile, iLenExecuting, and iLenObjClass.
You can adjust these values, using the _oCoverage reference, directly in the Command window. Before doing so, however, you'll want to understand how they're used; insufficient field lengths can cause Profiler errors. Information about this practice is available in the Help file, under the topic "Conserving Disk Space During Coverage Runs." There's additional helpful advice on this subject in COV_TUNE.H, one of the Coverage source header files.
Note��� Starting in VFP 6 SP3, you can also use iLenDuration to shorten the Duration field length. This new property defaults to 8 in 5.0 and the original release of 6.0, but will default to 11 thereafter to handle the change in log precision in SP3. The Duration field�s precision is set by N_COVLOG_PRECISION specification, in COV_SPEC.H header file, to match the version of VFP you are running.� (The N_COVLOG_PRECISION constant is set in the COV_SPEC.H header rather than COV_TUNE.H, to indicate that you should not tune this particular value.)
As with the other workfile field lengths, you should not change iLenDuration unless you find, after experience, that you don�t need the full default length of the Duration field.� Also, any value you set for iLenDuration must be sufficient to house the full log precision provided by your version of VFP.
If you look at the target file, you see three memo fields, each of which stores a copy of the source code for the record's source object or code file.
Note The three memo fields store Profiled, Covered, and original source code. The Profiler works with Visual FoxPro source files, such as .vcx files, and is designed to minimize the risk of this process. It opens each source file once, as briefly as possible, when you load the log. It stores a "clean" source copy, in the target cursor Sourcecode memo field, for use thereafter. When you or the Profiler indicate that a particular record should be marked, the Profiler checks its current marking mode (Profiling or Coverage). Depending on mode, the Profiler fills the Profiled memo field with profiling statistics for each line of code, or the Marked memo field with coverage-style marked code.
Ordinarily, all records except the first one have empty Profiled and Marked memo fields when you first load a log. If you've used the Options dialog box to "Mark all code while log loads," all records have the memo field for the current mode marked at once.
The Profiler retains the "clean" code in Sourcecode, even when both Profiled and Marked fields are filled for a particular record. (Because you may use the Options dialog box to change Coverage marks at any time, the clean version may be required more than once.) This fact makes the target cursor a convenient way for you to extract source code documentation for reasons having nothing to do with coverage or profiling.
You can see that filtering the target cursor would be a good way to prevent some of these memo fields from being filled. This would reduce disk space use if you're not interested in all the records.
Depending on how you do it, filtering the source cursor may also help you reduce
the time required when the Profiler gathers statistics. You notice that SET
DELETED is ON in this private data session. If you MODIFY
STRUCTURE for the source and target cursors, you find that each
has an index on DELETED( ). Because you can expect the Profiler to use
this tag when optimizing its statistics-searches, deleting records you don't
want to investigate will give you one way to reach your goal of saving time.
For your first add-in, therefore, you look at filtering and/or deleting records.
In the following examples, we're going to eliminate all menu file records from the log. This is a reasonable choice, because .mpr files are full of code that is not really worth profiling or examining for coverage purposes. Most lines in an .mpr file are GENMENU-generated DEFINE� lines, which execute once each, execute smoothly, and don't cause much of a problem. The programs invoked by menu options are a different story -- each program invoked is very likely to be in a different source file, not stored in the menu itself. Therefore, unless you use procedure results in .mnx files to store a lot of code, eliminating all menus is a valid suggestion.
Keep in mind that the same techniques are useful for any sort of record filtering. Here are just a few of the possibilities:
In many cases, you'll opt to decide which records to include dynamically when you load the log. You might have a unique combination of such "elimination and include" choices for each log run. Later in this document, you'll see how and where you'd insert a dialog box to ask for these choices.
The code you must write to filter or delete records is trivial, as you'll see shortly. But first, how does the Profiler execute it?
You can use the _oCoverage public reference to invoke the Profiler RunAddIn(<cAddInName>) method. Pass RunAddIn( ) the name of your add-in, with a full path if it's not available otherwise. Alternatively, in the standard Profiler interface use the Add-In dialog box to find your code (see Figure 2). The dialog box invokes the RunAddIn( ) method for you.
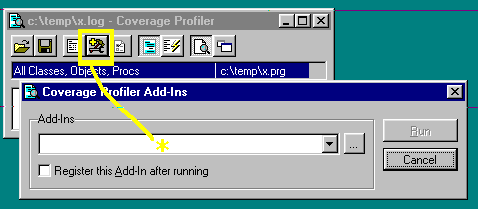
Figure 2. The Add-In dialog box in the standard Coverage Profiler interface
The RunAddIn method can handle files of these types: .fxp, .app, .prg, .exe, .qpx, .qpr, .mpr, and .mpx. It passes a reference to the Profiler to your add-in program.
Note If you would prefer not to accept the reference in your program, or if you would prefer to instantiate a class directly as your add-in, rather than using one of the allowable file types, you can still add features into the Profiler; just don't use the RunAddIn method. For example, you could create an add-in by using _oCoverage.NewObject(�).� Presumably your object would run some sequence of actions when it loaded, releasing itself or staying attached to _oCoverage as appropriate.
Now that you know how to call an add-in, you're ready to write one. Your first add-in simply checks that it received a valid reference and proceeds to remove menus from the source and target files (you'll find this code as COVADD1.PRG in the source for this article):
* COVADD1.PRG

LPARAMETERS toProfiler

IF TYPE("toProfiler.cSourceAlias") # "C"
   RETURN
ENDIF

LOCAL lcSource, lcTarget, liSelect
lcSource = toProfiler.cSourceAlias
lcTarget = toProfiler.cTargetAlias
liSelect = SELECT( )

IF NOT USED(lcSource)
   * Perhaps this procedure was called
   * using DO <prog> WITH _oCoverage
   * from the command window
   * for some reason...
   SET DATASESSION TO toProfiler.DataSessionID
ENDIF

IF NOT USED(lcSource)
   * It's remotely possible to
   * be between logs and still, somehow,
   * manage to call this program!
   RETURN
ENDIF

IF SET("DELETED") # "ON"
   SELECT (lcSource)
   SET FILTER TO Filetype # ".mpx"
   SELECT (lcTarget)
   SET FILTER TO Filetype # ".mpx"
ELSE
   SELECT (lcSource)
   DELETE ALL FOR Filetype = ".mpx"
   SELECT (lcTarget)
   DELETE ALL FOR Filetype = ".mpx"
ENDIF

SELECT (liSelect)
GO TOP IN (lcTarget)
toProfiler.NotifyTargetRecordChanged( )

RETURN
Because add-ins are designed to be flexible, it's worthwhile doing a little error checking and handling varying conditions, as in the preceding code. For example, although SET DELETED is ON by default, you might want to turn it off sometime and still use your add-in. That's why COVADD1.PRG handles both possibilities, using SET FILTER when SET DELETED is OFF. You could also create a filtered index for the same purpose.
At the bottom, you see the following method call: toProfiler.NotifyTargetRecordChanged( ). This call gives the Profiler a chance to synchronize its standard interface with the change you've made.
Your .prg file worked, and you're feeling brave, so you decide to add a little flexibility: you'd like to toggle your menu-viewing on and off in the Profiler. To accomplish this, you'll need to have a persistent effect on the Profiler between add-in calls, so you know the current state of your new feature. You can't just rely on the state of SET("FILTER") or look for DELETED( ) records, because other filters may exist and the Profiler deletes records for other reasons besides this one.
The Visual FoxPro version 6.0 AddProperty( ) method comes in very handy when you need to save information such as this "menu viewing toggle." After your initial check for a valid Profiler reference, you add a property to the Profiler:
* excerpted from COVADD2.PRG

IF NOT PEMSTATUS(toProfiler,"lMenuViewing",5)
   * First use; turn menus off.
   toProfiler.AddProperty("lMenuViewing",.F.)
ELSE
   * Toggle the current value.
   toProfiler.lMenuViewing = ;
      ! toProfiler.lMenuViewing
ENDIF
Now your add-in code proceeds to toggle between an empty filter or the filter you used in COVADD1.PRG or, if SET("DELETED") is ON, it RECALLs or DELETEs the relevant records. The full text of this program is COVADD2.PRG.
You're finding this new menu-toggle feature very useful, but it's annoying to have to use the Add-In dialog box every time you want to change your view of the Profiler contents.
The Add-In dialog box contains a check box (see Figure 2) with which you indicate that you want this add-in kept in a list for future use. In addition, the Profiler "remembers" the last add-in you ran successfully, so -- whether you use the dialog box or type _oCoverage.RunAddIn( ) in the Command window -- you can toggle the view easily. Still, you may want to create a series of several programs like this one, and run them at will without leaving the Profiler interface.
When you want an add-in to be instantly available, you can add it to the interface as a standard control. You can add your new control to the standard main dialog box, the Zoom dialog box, or even the Coverage frame -- but it probably makes most sense to put it with the other buttons in the main dialog box.
The main dialog box class used in the standard interface offers a special AddTool(tcClass) method to make this even easier. If you pass the name of your control class to this method, the dialog box adds it into the same container used for the other buttons. The dialog box is now aware of this extra control when it handles resizing and other chores.
Note��� Using the AddTool() method to add your controls into the standard dialog interface will have additional benefits if Microsoft changes this standard interface.� For example, Figure 3 below shows you our new example button as it appears in VFP 6�s first release.� However, VFP 6 SP3 has a new Find button.� Because we�ve used the .AddTool() method to add our button to the container, it is still properly positioned in SP3, without changing any code, as the figure shows.
In this case, we want a toggle button for our feature. We'll use a standard command button and change its picture to indicate the current file state (view menus or eliminate them).
The program instantiating this button is COVADD3.PRG. When you run the add-in, COVADD3.PRG executes this simple code:
* excerpted from COVADD3.PRG

LPARAMETERS toProfiler

IF TYPE("toProfiler.cSourceAlias") # "C" OR ;
      TYPE("toProfiler.lMenuViewing") = "L"
   * Profiler reference not passed
   * or this button already exists.
   RETURN
ENDIF

toProfiler.frmMainDialog.AddTool("MenuFilterButton")

RETURN
The balance of COVADD3.PRG contains three class levels that, together, create this button:
Running COVADD3.PRG as an add-in gives you instant access to COVADD2.PRG, as shown in Figure 3.
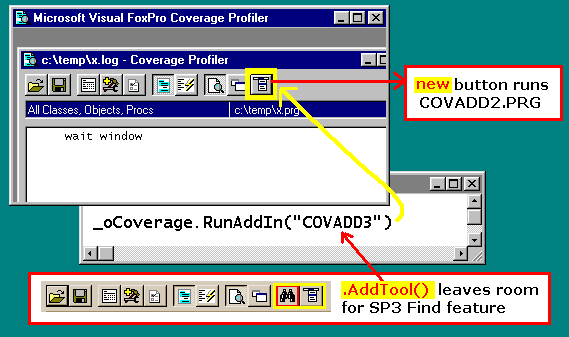
Figure 3. COVADD3.PRG makes the COVADD2.PRG add-in code accessible in the standard Profiler interface.� Because it uses the main dialog�s .AddTool() method, the new button is properly positioned in any version of the standard COVERAGE.APP interface.
You can see where this approach can take you. Instead of a simple toggle, your button can call a dialog box and decide which types of files you wish to see, or do any other filtering you want. You can use the registry-accessing methods of the Coverage Profiler to store your choices, so your add-in has influence on the Profiler that persists beyond a single session.
Looking over what you've accomplished, you have the mechanics of add-ins down pat, but you haven't necessarily satisfied your original goals. With large files, the overhead of deleting and filtering may outweigh the benefits of removing unwanted records from processing. You do gain some benefit, as you cursor through the target list in the Profiler interface, from not having to pause to mark those records that do not interest you, such as MPRs. But you lose this benefit when you choose Mark All On Load from the Options dialog box, and you have an easier way of specifying the records you wish to mark by going into "Fast Zoom mode" in the standard Profiler.
Note To use Fast Zoom, press the Zoom button in the main dialog box. Once in Zoom mode, with code showing in the separate Zoom dialog box, right-click anywhere in the Profiler to choose Fast Zoom mode. Now, as you cursor through the list of target files and objects in the main dialog, the Profiler will not mark every record automatically. You'll need to double-click or hit Enter in the list to indicate that you wish to mark a particular record. Fast Zoom is a good way of dealing with logs that include many source files of no interest to you.
You resolve to move on to different choices to meet your disk space and speed concerns, but you've already learned enough to create much more compelling add-ins of this type.
For example, suppose you wanted to order the target objects and files in the interface, rather than remove some entries? You could easily solve this requirement with a control in the main dialog box (perhaps an option group or drop-down list, showing the orders you prefer to expose).
COVADD4.PRG gives you a quick example. It's almost exactly the same as COVADD2.PRG, but toggles the target cursor between natural order and order by file type, rather than filtering records. It creates a FILETYPE index on the fly as necessary, without disturbing the Profiler operations in any way. Of course, you could easily create a button class descending from ToolButton class, like the MenuFilterButton in COVADD3.PRG, to run the code in COVADD4.PRG from your Profiler interface.
Going back to your original purpose, you realize that you can influence the workfiles more completely if you adapt the log before it is loaded at all. If the text log is shorter and contains only the records you want, the source cursor is much smaller, and the target cursor has fewer objects to analyze.
COVADD5.PRG is an add-in to perform this task. It uses low-level file functions to examine the text of the original log and writes out appropriate lines to a new log of the same name, saving the original to a backup name.
Although COVADD5.PRG is longer than we can comfortably reprint here, it has a very straightforward structure.
First, COVADD5.PRG adds a custom object to the first form in the Profiler Forms( ) collection. The CustomCoverageLoader class specified here is DEFINEd in COVADD5.PRG:
* excerpted from COVADD5.PRG
* Check to make
* sure this object doesn't
* already exist, and then:

toProfiler.Forms(1).AddObject("oLogLoader",;
                 "CustomCoverageLoader")
This technique takes advantage of the fact that the Profiler is based on a formset, with a native Forms( ) collection readily available to you. The Profiler formset origins also give it the inestimable ability to maintain a private data session, as you've already seen. Formset attributes, such as the AutoRelease property and formset-level Activate( ) and Deactivate( ) methods, allow the Profiler to act as a coherent unit -- even when it doesn't have information about its component forms.
In this case, when you add this custom object into the first-instantiated member of the Profiler Forms collection, you're actually adding a member to an invisible toolbar. The Profiler has no required visible interface and maintains this toolbar as a place for members such as this Loader object.
Note By placing your custom object in the handy toolbar, rather than on any of the visible forms, you can avoid disturbing any form-arranging code. Often, such code iterates through objects contained in the form, and sometimes this code adapts poorly to new, unforeseen members. As you'll see later in this article, it's possible to have many "foreign" forms managed by the Profiler. Avoid actions that require complete control over all of them.
The new custom object has a single Load( ) method, which will do the actual work of asking the user for a log file name and parsing the log.
Next, COVADD5 SETs PROCEDURE TO COVADD3 to have access to the ToolButton class we've already used. It invokes the AddTool( ) method of the Profiler main dialog box to add a button subclassed from ToolButton into the standard interface. This ToolButton Click method calls the custom object Load( ) method, as follows:
* CustomLoaderButton.Click( ) in COVADD5.PRG

IF TYPE("THISFORMSET.Forms(1).oLogLoader") = "O"
   * As always, do an extra check to
   * make sure your Loader object exists,
   * just in case some "competing" add-in
   * or errant Profiler action inadvertently
   * removed the member you created.
   THISFORMSET.Forms(1).oLogLoader.Load( )
ELSE
   * Include an error messagebox here if you wish.
ENDIF

RETURN
When you wish to open a log, you now have a new button that handles the log-opening process a little differently than the Profiler standard Open button.
In the CustomCoverageLoader.Load( ) method, the Profiler SetLogFile( ) method executes, so the user can pick a new log. The log is validated, using the Profiler SourceFileIsLog( ) method. Now your intervention can occur safely.
At this point in the process (after log validation), you have an opportunity to create a modal dialog box or other interface instead of unilaterally removing menu code lines from the log, as the example code does. You'll see comments indicating this opportunity at the appropriate place in COVADD5.PRG, and a MESSAGEBOX( ) as a placeholder for your interface code when you run it.
The user can restrict the analyzed files in almost unlimited ways, depending on how you prepare this interface. You could even bring the original log up for editing, as a MODIFY FILE. (The Visual FoxPro editor handles text files of any length, very efficiently.) The user could excise sections that involved "uninteresting code," or paste sections of "interesting code" into a second, shorter log.
However you decide to limit the logs, you end up with some criteria by which log lines should be included and/or excluded from analysis. You now use the low-level file handling techniques you see in the Load( ) method to write out the new log with only the lines you want.
The code in the Load ( ) method also includes a little extra "bonus" code to take advantage of two of the Profiler field-size-limiting properties (iLenObjClass and iLenExecuting). The size requirements for these fields are based on entries from the log, which are transferred first to the source cursor and later, in somewhat altered form, to the target cursor. Because you're already going through the text log line by line before creating the first of these workfiles, it seems only natural to figure out the maximum required field lengths for the current log at the same time.
After the new log is ready, Load( ) stores new field sizes, derived from information in this specific log, to these two properties (see Figure 4). The Profiler uses the new values in its CreateSourceCursor( ) and CreateTargetCursor( ) methods for a considerable savings in disk space per record in both temporary files.
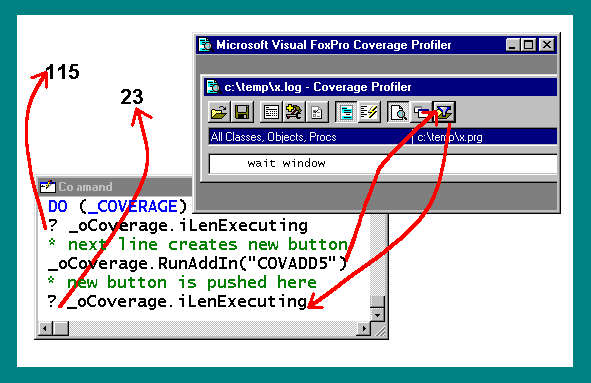
Figure 4. COVADD5 shows you how to truncate a log and how to limit the field sizes for Coverage workfiles at the same time.
Note As the Help file entry on "Conserving Disk Space During Coverage Runs" explains, it's very important to ensure proper field length for the Hostfile field to avoid Profiler errors. Still, you may find it odd that the code in this method doesn't perform a similar check on maximum length of source code file names and adjust the Profiler iLenHostfile value at the same time as it adjusts iLenObjClass and iLenExecuting.
There is a good reason not to use the current contents of the log as the basis for the length of the Hostfile field: The text file file name may bear no relationship to the fully qualified file name the Profiler stores to its workfiles.
If you generate the log on one computer and then analyze the log on a second computer, the source code may not be in the same locations you see in the text log. The Profiler will ask you to locate these source files and store the correct information to its workfiles, as needed.
Why would you generate the log on one computer and analyze on another? To get accurate and complete profiling results, you may want to run the application on a very slow computer. To maximize the speed of analysis, or to make sure you have sufficient disk space for analysis, you may then move the log to a faster computer and load the Profiler. Even if you don't physically move the text log, source code may be located along a different path from what you see in the log, if you analyze source code over a network.
As a general rule, the Hostfile field must be long enough to include the longest possible file name, including full path, that the Profiler might need to store the name of your source code file. You can decrease this length with care if you're sure you don't need the entire default length of 115 characters. You can also increase this length if necessary, provided you remember one additional rule: The combined lengths of the Hostfile and Objclass fields must not exceed 240 characters. This figure is the maximum index key length, and the Profiler uses these two fields together in a required index expression.
Now you're cooking! Satisfied with the general strategy in the CustomCoverageLoader.Load( ) method, you create an expanded version of COVADD5.PRG, with an interface that lets you pick and choose among directories, file types, project contents, and so on. You decide to use this version of the "Open log" code all the time.
To make the add-in available immediately, you might start up the Profiler with the name of your add-in as third parameter:
DO (_COVERAGE) WITH ;
   <your log file>,
   <automated mode?>,
   <your addin>
You could even change the standard Tools menu Coverage Profiler
option to invoke the Profiler this way. Simply RELEASE BAR
_MTL_COVERAGE of _MTOOLS
and replace it with one of your own.
However, this will install the Filter Open button in your interface without affecting the initial log that was analyzed on startup. The initial log will be opened by the standard opening code instead of your customized version.
Besides, almost by definition, an add-in is something you don't use all the time. If you always want your filtering options in the Profiler, do you really need two buttons in the interface?
You realize it's time you made some changes in, rather than additions to, the Profiler features.
This realization is the same as every other object design epiphany you've had: You've gotten to the point where you really know what you want, you need it in multiple situations, and it's time to create a class to create it.
When you examine the delivered Coverage Profiler, you see that it instantiates a class in COVERAGE.VCX named cov_Standard, which descends from cov_Engine, also in COVERAGE.VCX. Both classes look the same in the Class Designer: formsets with a single toolbar object, invisible at run time. When you look deeper, you'll see that cov_Engine provides all the functionality that handles the workfiles, finds the source code, and so on, while cov_Standard adds a user interface (UI) to display the results of cov_Engine work. We'll refer to them as the standard UI class and the engine class.
The Class Designer window you see in Figure 5 shows cov_Standard. Although, superficially, this screenshot could be either of the two classes, the set of properties and methods you see here is the full set of properties, events, and methods (PEMs) augmented or added by cov_Standard. Its engine superclass has a much more extensive set of PEMs. (You'll find each one listed and described in the Help file, under the topic "Coverage Engine Object.")
Many of the standard UI class enhancements add code to methods left blank in the engine, such as StandardRightClick( ). This method allows you to create consistent right-click behavior when you add many interface elements to the Profiler interface, simply by delegating their right-click events to the formset. (In Figure 5, you'll see that the description for this method includes the information that this method is abstract at the engine level.) Your own subclasses can, and will, have very different uses for StandardRightClick( ) than the context menu you see in the standard UI.
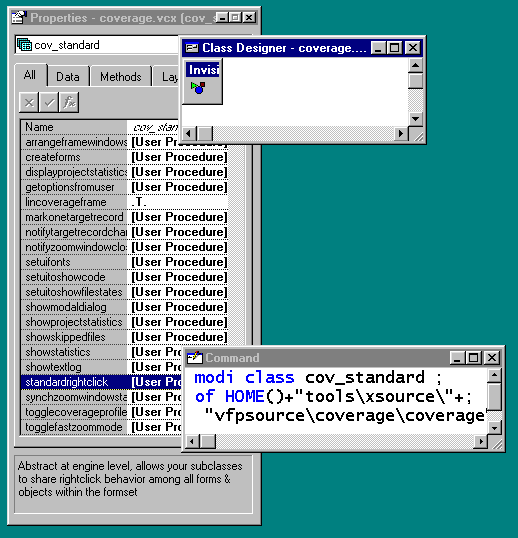
Figure 5. The standard UI Profiler class in the Class designer, with all edited PEMs showing
As you explore cov_Standard, you see that it uses the CreateForms( ) method to add its main and zoom dialog boxes to the user interface. This method is not abstract in the engine (note the difference in its method description). The engine superclass creates and manages the Coverage Multiple Document Interface (MDI) parent form in this method when the Profiler exists in a separate frame. Having called back to the engine code, each subclass can decide what child forms to place in the frame.
You can see that, along with StandardRightClick( ), the CreateForms( ) method is another critical component to building your own interface. Looking at the engine methods augmented by cov_Standard, in fact, is a great way to get clues about which methods will require code in your own subclass.
You've looked at the standard UI class, and you feel ready to subclass it. You had planned to augment the Init( ) a bit to invoke your add-in at startup even when it wasn't specified on the command line. As usual in class design, however, you can see that it might be wise to step back a bit. First, you'll create a "buffer" parent class between cov_Standard and your own experiments with a few changes that will suit more needs than your current goal.
The standard Profiler can be instantiated by the Tools menu option because its coverage.app file is the contents of _COVERAGE system variable. To instantiate your own Profiler, you may eventually change the contents of this variable, but you'll probably want to experiment quite a bit first. You'll also want to instantiate these subclasses as quickly as possible without building each one into a separate .app file unless absolutely necessary.
When you first subclass cov_Standard in your own .vcx file, however, you find there seem to be some limitations without a supporting .app file. The standard class instantiates other classes later on (instances of the common dialog box .ocx file, as well as dialog boxes), and uses other files (graphics and a report form). Because these files are built into its .app file, the standard class has no difficulty finding them.
For your own experiments, you may or may not want these original components available to you. The good news: you can subclass cov_Standard to find all the classes necessary, as long as _COVERAGE still contains the original COVERAGE.APP or the subclass has any other way of finding COVERAGE.VCX. The bad news: you don't necessarily gain access to the non-OOP files (the graphics and report form).
Recognizing these issues, you can create a subclass that needs no help from an .app file, and can instantiate its descendents with a simple NEWOBJECT( ) call on the command line. Such a "bare-bones" approach is very helpful when you're trying new approaches.
You'll find cov_Subclass_Standard, in the COVNEW.VCX library with the source for this article, gives you exactly what you need. All the additional subclasses of cov_Standard discussed in this document descend from cov_Subclass_Standard.
Cov_Subclass_Standard augments only three cov_Standard methods, according to the following simple plan (see results in Figure 6):
In this method, the subclass also checks to see if it can find appropriate graphics files expected by the standard UI dialog boxes. If not, it puts up a message box for the user, explaining what to expect.
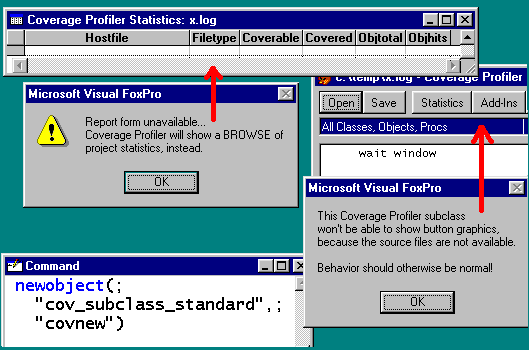
Figure 6. Cov_Subclass_Standard can handle a "bare-bones" instantiation of a coverage subclass, with no surrounding app, and with only minor sacrifices, as shown in this composite screen shot.
With this bit of housekeeping settled, you can subclass cov_Subclass_Standard for new functionality.
You remember you wanted to install your FilterOpen button on startup, to make it available all the time. Your first "real" subclass of cov_Subclass_Standard could run COVADD5.PRG explicitly during startup procedures, but you decide to make it a little more versatile.
Figure 7 shows you all the modifications in cov_RunMyAddIn. This subclass of cov_Subclass_Standard automatically runs an add-in on startup, if you've attached one to the class and don't override the information by passing the add-in parameter. By default, it's going to create the FilterOpen button. However, you can see that simply by changing the contents of the cAddIn property, you could have several subclasses of cov_RunMyAddIn, each set to automatically install one "favorite add-in."
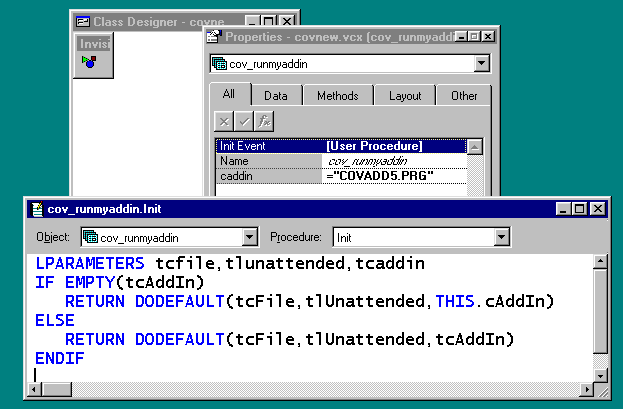
Figure 7. Cov_RunMyAddIn is a simple subclass of cov_Standard_Subclass.
The approach you took in cov_RunMyAddIn may be fine for some other features you wish to add to the Profiler. For example, the ordering utility we sketched in COVADD4.PRG is a perfect candidate for a new button in the Profiler interface. A cov_RunMyAddIn subclass could specify the PRG instantiating this button.
But you decide to go still further with your version of the "log open" code. Why not make your version of the "open" code available, no matter how or when a log is opened?
The Open button in the standard main dialog box of the interface calls THISFORMSET.SetupWorkFiles( ). Because this is the standard method of opening a log in the Profiler, this is the place to look for clues. In fact, this method contains a sequence of steps that is very similar to the ones you took in COVADD5.PRG, minus your special log-limiting features.
In COVADD5.PRG, you intervened in the log analysis just after the source log was approved as valid by SourceFileIsLog( ). SetupWorkFiles( ) contains a series of steps you don't want to disturb: It identifies a new log to open, validates the log, and continues to create the new workfiles from this log.
To intervene in these steps at the same point as before, you augment the SourceFileIsLog( ) method. After you use DODEFAULT( ) to call back to superclass code in this method and receive a positive response, you can rewrite the log to contain only records of interest to you. SetupWorkFiles( ) will proceed to create the workfiles from your new information.
You'll find cov_FilterOpen, a subclass of cov_Subclass_Standard, in COVNEW.VCX. It performs exactly this function (augmenting SourceFileIsLog( )) and changes no other PEM of its parent class.
The SourceFileIsLog( ) code in cov_FilterOpen is essentially the same as COVADD5.PRG, right down to the comments that show you where to insert your dialog to give the user a chance to make choices at run time. Like COVADD5.PRG, this method code also adjusts the workfiles field lengths to match the contents of the current log.
What's the difference between this subclass and the add-in you run in COVADD5? You now get your desired functionality every time your version of the Profiler opens a log. You don't have to make any change to the interface, or invoke an add-in or, in fact, make any conscious decision to use it.
You've reached a really good solution for your original problem. With a subclass that intervenes in the engine behavior at precisely the right moment, you can optimize both disk space usage and analysis speed in the Profiler. However, you're beginning to see that you've only scratched the surface of the features you can get by subclassing the Profiler.
From the Statistics dialog box, you know the Profiler gathers information suitable for displaying "percentage Coverage." It might be nice to see a graphical view of this information.
You also notice that the text log contains program stack information, faithfully translated to the Profiler source cursor, but not otherwise indicated in the Profiler interface. You might find a program stack display useful, but there isn't a good place for this information in the standard UI.
The standard UI can "stretch" to contain additional forms, displaying
the information in its workfiles in additional ways. Cov_AddDisplay is
a subclass of cov_Subclass_Standard that shows you how to give the standard
UI these additional display elements, without too much fuss. It instances two
form classes, frmGraphicalCoverage and frmStackLevel, as members
of the Profiler formset. Figure 8 shows you what it looks like, instantiated
by a simple NEWOBJECT("cov_AddDisplay", "COVNEW")
statement.
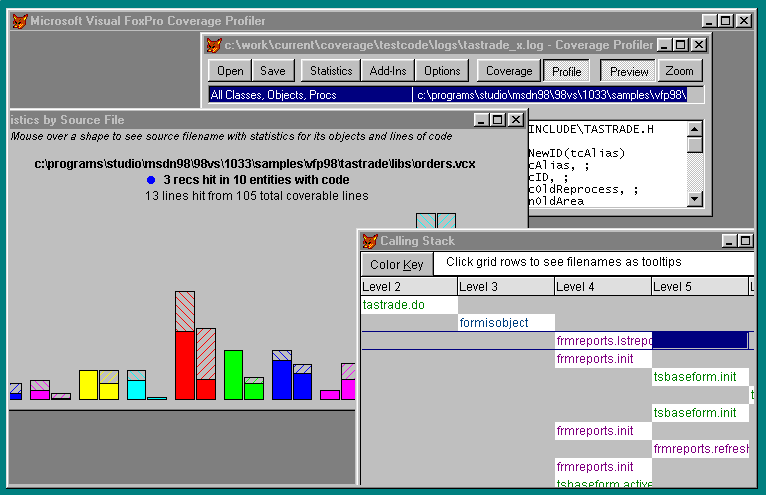
Figure 8. Cov_AddDisplay adds two form classes (frmGraphicalCoverage and frmStackLevel) to analyze the current log in different ways.
To accomplish this feat, cov_AddDisplay needs to augment only two methods.
In CreateForms( ), cov_AddDisplay runs the following code:
* cov_AddDisplay.CreateForms( )

IF DODEFAULT( )

   THIS.NewObject("frmGraphical", ;
                    "frmGraphicalCoverage",;
                    THIS.ClassLibrary)
   THIS.NewObject("frmStack",;
                    "frmStackLevel",;
                    THIS.ClassLibrary)
   THIS.frmStack.Visible = .T.
   THIS.frmGraphical.Visible = .T.

ELSE
   RETURN .F.
ENDIF
The second augmented method is SetUIToShowFileStates( ). The engine calls this method to alert its subclasses to the need to bind controls to a new set of workfiles as part of the SetupWorkFile( ) process, so you notify your own new forms along with the rest of the formset "family":
* cov_AddDisplay.SetUIToShowFileStates( )

LPARAMETERS tcSource,tcTarget

IF DODEFAULT(tcSource,tcTarget)

   * Type checks
   * in case the forms were released.
   IF TYPE("THIS.frmGraphical") = "O"
      THIS.frmGraphical.LoadFile( )
   ENDIF

   IF TYPE("THIS.frmStack") = "O"
      THIS.frmStack.LoadFile( )
   ENDIF

ELSE
   RETURN .F.
ENDIF
As you see here, we've created a custom method, LoadFile( ), in both our new form classes, where each form class will proceed to look at the current Profiler workfiles and decide what to do.
If you resolve to follow this approach consistently, perhaps creating a form ancestor class to use for all your Profiler displays, you might create an abstract Loadfile( ) method in the form class. This method should accept the same source and target arguments as SetUIToShowFileStates( ), in case its Profiler was analyzing multiple logs. (You'll see a Profiler using multiple logs later in this section.) With a convention of this sort, you could write a more generic SetUIToShowFileStates( ) method, like this:
* yourSubClass.SetUIToShowFileStates( )

LPARAMETERS tcSource,tcTarget

LOCAL loForm

IF DODEFAULT(tcSource,tcTarget)
   FOR EACH loForm IN THIS.Forms
   IF PEMSTATUS(loForm, "LoadFile",5)
     loForm.LoadFile(tcSource,cTarget)
   ENDIF
   ENDFOR
ELSE
   RETURN .F.
ENDIF
As you probably realize by looking at Figure 8, the real trick for each new display is going to be the code in its LoadFile( ), and the code in frmGraphicalCoverage.LoadFile( ) has almost nothing in common with frmStackLevel.LoadFile( ).
From their behavior as well as their code, however, you notice, that they share a few features outside the LoadFile( ) method:
You can also call the AddFormPositionSaver(toForm) method explicitly later in the life of your Profiler class, whenever you add a form to the Profiler formset -- simply pass the method an object reference to your new form and it will have this custom member.�
Each form contains a few tricks and novelties, but none is pertinent to what you need to know for other, dissimilar, Profiler displays. You can investigate them at your leisure.
Note We'll just stop to mention one small item in the frmGraphicalCoverage class that may seem odd to you. The form contains a small, read-only text box you can't see either at design or at run time, and that has no obvious function. The text box is necessary for the form to gain focus when you want to read its contents, because frmGraphicalCoverage doesn't have any editable Visual FoxPro controls or ActiveX elements, just a few labels. FrmGraphicalCoverage.LoadFile( ) draws the entire graph using the form Box( ) method!
Things are getting a little more exciting. However, now your Profiler display is a little difficult to organize, with its various forms all jumbled up trying to present the same data for different purposes. Some presentation formats, such as frmGraphicalCoverage, may require all records to be marked before they load, so they may be forcing some extra work when you're not really interested in their form of display. Other formats, like frmStackLevel, require their own workfiles to operate, which means you're using extra disk space you don't need, if the program stack doesn't interest you all the time.
Maybe you don't want to subclass the standard UI after all. Maybe you want to design a completely new version of the Profiler, or several, each with just the UI you want.
It's time to look at cov_Engine, the underlying Profiler class that does the real work of log analysis. Because it has no user interface of its own, you subclass cov_Engine when you want to design a fresh Profiler UI.
You start with a particular goal in mind; perhaps you want a display with only stack information displayed, using frmStackLevel. However, as you found with cov_Standard, you soon drop back a bit. An intermediate class level between cov_Engine and your stack-displaying subclass gives you a chance to design for future engine subclasses.
Cov_Subclass_Engine is even simpler than cov_Subclass_Standard. As you may remember, when we subclassed cov_Standard for the first time, we were primarily concerned about the subclass being able to find all its interface pieces at run time, even with no .app to bind these files. We'd like to do the same thing to cov_engine, but the engine has a lot less interface, so there's a lot less to worry about. It has no graphics or report forms, for example. In fact, you only need to take care of two possible types of objects the engine may try to instantiate during its run:
In the COVNEW.VCX examples you'll find we've solved this problem very simply: The engine lUsingOCXs and lInCoverageFrame properties both get new access methods, which always RETURN .F.
With lUsingOCXs set to .F., the engine turns to the Visual FoxPro GETFILE( ), PUTFILE( ), and GETFONT( ) functions to fulfill requirements usually managed with the common dialog boxes. Setting lInCoverageFrame to .F. forces the Profiler interface to appear in the Visual FoxPro application window.
In subclasses of cov_Subclass_Engine, you'll rarely have a reason to change the lUsingOCXs access method. After all, the standard behavior of Profiler -- as specified at the engine level -- gives you GETFILE( ), PUTFILE( ), and GETFONT( ) in preference to the common dialog boxes, for the duration of any Profiler run, if any OLE error occurs during normal operation. You should not see any significant difference in functionality without the common dialog boxes.
In many cases, these subclasses have no need for the Frame window either. Quite a few engine subclasses will have no interface at all (you'll find examples to follow). Subclasses that require the MDI frame can adjust the lInCoverageFrame_Access method to RETURN .T. if the appropriate class library is available. You can adjust cAppHome to point to COVERAGE.APP, as we did in cov_Subclass_Standard, or you can create your frame using a different class altogether.
Besides two one-line access methods, RETURNing .F., cov_Subclass_Engine makes absolutely no adjustments to cov_Engine. Yet it's far from an abstract class; it's a perfectly viable Profiler on its own.
Try it out, by instantiating it with this line of code in the Command window:
NEWOBJECT("cov_Subclass_Engine","COVNEW")
This code produces a standard GETFILE( ), seeking a log file name,
followed by some requests to locate source files, if there are any the Profiler
can't find. Other than that, it seems nothing has happened. Still, try cursoring
up a line in the Command window and pressing Enter on the same line of code;
a WAIT WINDOW informs you that the Profiler is already active. If you now SET DATASESSION
TO (_oCoverage.DataSessionID)
and check the Data Session window, sure enough, you'll see your workfiles.
If you browse your target cursor (MarkedCode), however, you'll find that only the Sourcecode memo field is filled out. Unless you've previously saved the Mark all code on load option as a default setting, no code has been marked and no statistics are available.
Without an interface, you can still mark these records interactively, and even save the results to disk (see Figure 9). In some situations, this may be all the Profiler you really need.
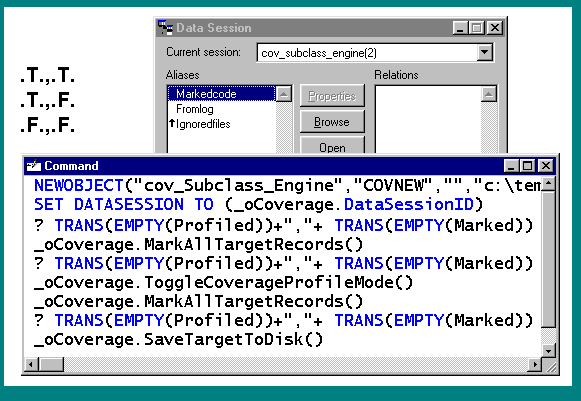
Figure 9. Cov_Subclass_Engine offers you a Profiler with no interface, but it's still fully functional.
You'll find you can even call the Profiler GetProjectStatistics( ) method interactively. You'll get a new workfile, defaulting to the alias PJXFiles, with all the data you normally see in report form when you ask the standard UI for Project Statistics.
Subclasses of cov_Subclass_Engine can query the workfiles, adding new sets of statistics to this base. They can continue to have no display at all, saving their results to disk.
Cov_Automate is one such simple subclass of cov_Subclass_Engine with no display, designed to automatically save its workfiles to disk. This type of Profiler is especially valuable during automated testing, because in its "unattended mode" you can call the Profiler to act on a specific log and then continue with more test runs.
However, cov_Automate works in both unattended and interactive modes, giving you a chance to feed multiple log names to this invisible Profiler, specifying its output file names interactively if you wish.
This subclass adds an access method for the lMarkAllOnLoad property that always RETURNs .T., no matter what default you've saved for this option, so the files you'll save to disk contain marked source code for each record. It adds the ability to save the source cursor along with the target cursor -- something you won't want to do as often, but you may want to do occasionally. Finally, it augments the critical SetupWorkFiles( ) method to include these tasks in its processing of each log, as follows:
* cov_Automate.SetupWorkFiles( )

LPARAMETERS tcLogfile,tcSource,tcTarget

IF DODEFAULT(tcLogfile,tcSource,tcTarget)

   THIS.ToggleCoverageProfileMode(tcSource,tcTarget)

   * Because lMarkAllOnLoad is .T.,
   * toggling the mode will automatically
   * fill the other memofield with marked contents.
   THIS.SaveTargetToDisk( )

   * New method and property in this subclass:
   IF THIS.lSaveSource
      THIS.SaveSourceToDisk( )
   ENDIF

ELSE
   RETURN .F.
ENDIF
The new SaveSourceToDisk( ) method in this class follows the model set by SaveTargetToDisk( ):
* cov_Automate.SaveSourceToDisk( )

LOCAL lcDBFName, liSelect

* Get a default tablename for the save-to-disk.
lcDBFName = THIS.GetTableName("_SRC")

IF NOT THIS.lUnattended
   * Ask the user whether this name is okay:
   lcDBFName = ;
        THIS.GetResourceLocation(    ;
                THIS.cSourceFile, ;
                COVNEW_SAVESOURCE_LOC, ;
                "Tables" + " (*.dbf)|*.dbf", ;
                lcDBFName, ;
                "PUTFILE")
ENDIF

IF (NOT(EMPTY(lcDBFName)))
   liSelect = SELECT( )
   SELECT (THIS.cSourceAlias)
   COPY TO (lcDBFName)
   SELECT (liSelect)
ENDIF

RETURN
As you can see, this is not complicated code. The hardest part is probably learning the full set of arguments to the engine GetResourceLocation( ) method, which you'll find discussed in the Help file.
If you create a fully-automated version, without asking the user for file name confirmation, you may wish to take advantage of the fact that the engine GetTableName( ) method always generates a new unique file name. (There is no possibility of overwriting previous runs.) Otherwise, there are no tricks here, just the kind of cursor and statistical manipulation that you, as a database application developer, already know how to do.
Once you've added your custom processing to an engine subclass, your subclass doesn't have to be invisible, of course. You can add any presentation format you wish, as you'll see in the next section.
Cov_NewInterface shows you how to add a presentation format to an engine subclass. As you see in Figure 10, we've reused the frmStackLevel class in COVNEW.VCX here, to provide the only display for this Profiler.
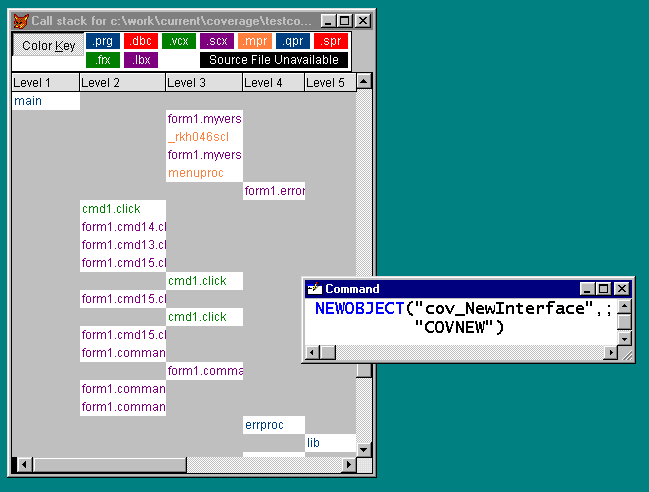
Figure 10. Cov_NewInterface uses frmStackLevel for its display.
Now that the frmStackLevel dialog box does not coexist with the standard UI, when you want to open a new log this interface has no obvious way to do it. For this reason, cov_NewInterface places code in the engine StandardRightClick method:
* cov_NewInterface.StandardRightClick( )

THIS.SetupWorkFiles( )
RETURN
Because frmStackLevel components all delegate back to this method of their parent container, that's all we require. A right-click on the grid surface or the color key will present a GETFILE( ) asking the user to pick a log.
Note Because frmStackLevel is a simple example, you'll notice that clicking the text boxes in the grid, as opposed to empty grid surface, will not present the GETFILE( ). You'd need to add a custom text box with RightClick( ) method code to do this. You could also subclass frmStackLevel to include a standard Open button, for use as a stand-alone interface.
Other than its StandardRightClick( ) code, cov_NewInterface is not very different from the cov_AddDisplay subclass of the standard UI you saw earlier. It has similar code in its SetUIToShowFileStates( ) method:
* cov_NewInterface.SetUIToShowFileStates( )

LPARAMETERS tcSource,tcTarget

IF DODEFAULT(tcSource,tcTarget)
   THIS.frmStack.Caption = COVNEW_CALLSTACK_FOR_LOC+;
     " "+THIS.cSourceFile
   THIS.frmStack.LoadFile( )
ELSE
   RETURN .F.
ENDIF
And, also like cov_AddDisplay, it has code in its CreateForms( ) method:
* cov_NewInterface.CreateForms( )

IF DODEFAULT( )
   THIS.NewObject("frmStack","frmStackLevel",;
                  THIS.ClassLibrary)
   THIS.frmStack.Visible = .T.
ELSE
   RETURN .F.
ENDIF
That's all there is to it. This subclass contains no other code or new properties.
Because cov_NewInterface has only one form, it doesn't instantiate an MDI frame to contain its display elements.
Your engine subclass might have more than one form. For example, cov_NewInterface doesn't really make use of the engine's ability to mark code as yet. You could have a main interface, such as frmStackLevel, but provide a method of zooming into the marked code for any object in the call stack. When the user chose to do so, you'd mark the appropriate object record in the target cursor with the engine MarkOneTargetRecord( ) method. Then you'd bring up the results in a separate form.
In this case, you'd adjust the lInCoverageFrame_access method as appropriate, ascertaining that your frame class was available. Your CreateForms( ) method for such a class would look like this:
* yourMultipleFormsDisplaySubclass.CreateForms( )

IF DODEFAULT( )

   * Do any additional setup work here,
   * and then, when ready:
   IF THIS.lInCoverageFrame
      THIS.oFrame.Show( )
   ENDIF

   * Here, instantiate your forms
   * and make them visible --
   * or make only some of them visible
   * at first, if you prefer.

ELSE
   RETURN .F.
ENDIF
Without much effort, you've been able to analyze and display coverage logs "six ways from Sunday." Now, however, you want to look at the profiling data for a particular sequence of application methods on multiple computers. At other times, you expect to set up several different automated testing sequences, and you want to compare how well-covered your code is, using each automated sequence.
In such a case, you will benefit from comparing multiple coverage logs within the same interface. The engine class is well-equipped to handle this need, because each engine method that handles its workfiles allows you to pass the relevant aliases, rather than relying on the default aliases you've seen so far. By designating aliases explicitly when you call these methods, you can handle as many logs as you wish -- without the overhead of multiple engine objects.
Cov_ManyLogs is the sample cov_Subclass_Engine descendent that shows you how. To keep it simple, it uses only a very basic interface to display each log, provided by the frmQuickUI class (see Figure 11).
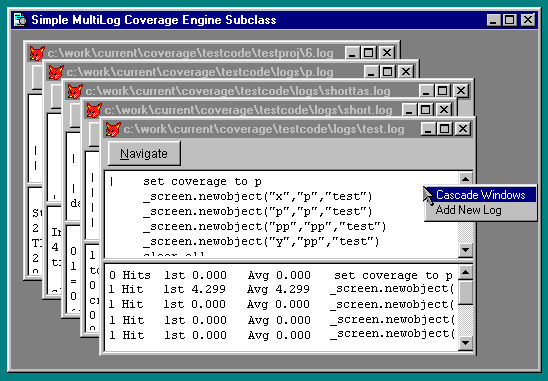
Figure 11. Cov_ManyLogs can compare records in several Profiler target cursors at once.
The Cov_ManyLogs augmented SetupWorkFiles( ) method generates a new pair of source and target aliases, and instantiates a new copy of its dialog box, for each log you load. In the Cov_ManyLogs.SetupWorkFiles method to follow, notice how each engine method call passes these aliases as parameters, to make the engine work on the right pair of aliases each time:
* cov_ManyLogs.SetupWorkFiles( )

LPARAMETERS tcLogfile,tcSource,tcTarget

LOCAL lcSource, lcTarget
lcSource = "S"+SYS(2015)
lcTarget = "T"+SYS(2015)
SELE 0

IF DODEFAULT(tcLogFile,lcSource,lcTarget)
   THIS.MarkAllTargetRecords(lcSource, lcTarget)
   THIS.ToggleCoverageProfileMode(lcSource,lcTarget)
   THIS.oFrame.Show( )
   SELECT (lcTarget)
   THIS.NewObject(lcTarget,"frmQuickUI",THIS.ClassLibrary)
   THIS.&lcTarget..Show( )
ENDIF

RETURN
Beyond this change, you'll find cov_ManyLogs contains little code. As you see in the figure, it has a StandardRightClick( ) method appropriate to its requirements (a context menu with one option to cascade all forms, and another option to load additional logs).
Because of its nature as a multilog viewer, this subclass reverses the decision of cov_Subclass_Engine and always appears in a separate MDI frame. To gain access to the frame class in COVERAGE.VCX, it also specifies the cAppHome property in SetAppHome, much as we did in cov_Subclass_Standard. Beyond this, it has a rudimentary Cascade( ) method to handle its forms, nothing more.
You notice that cov_ManyLogs doesn't bother passing frmQuickUI the appropriate target alias when it instantiates this form. Because of the timing of its instantiation, frmQuickUI looks at the current alias as it loads, and identifies this cursor as the target workfile for display. It binds its edit boxes to the appropriate target memo fields and saves the alias of this cursor in a custom property. Once the form is loaded, its Command button uses this alias to present a Browse to the user, providing a simple method of navigation between records in the correct workfile.
The frmQuickUI class doesn't use the source cursor, and the engine doesn't do any further work on these tables after it marks all records during the course of SetupWorkFiles( ), as just shown. In this simple case, therefore, the Profiler doesn't save this information for future use.
However, most multilog Profilers will probably want to add a member array so they can keep track of the aliases in use for their various sets of workfiles. Often each array row will have a third column that references the associated form displaying each set of workfiles. With this information saved, these subclasses can make sure to call methods with the right pair of source and target cursors, associating each pair with the correct form.
You've learned everything you need to know to provide an almost unlimited variety of Profiler subclasses. Mulling over your original goals, you realize you still have room for productive changes. Suppose you eliminated access to one of the two marking modes (Coverage and Profiling)? If you're only interested in one mode, you don't need both memo fields, which could certainly save disk space. You'll find the engine provides an AdjustTargetCursor( ) abstract method you can use to remove one of the two fields, after it creates this workfile, and before the memo fields in any records are filled. You can also use this hook to add fields -- or additional indexes -- to suit different needs.
The particular problem we started out to explore, tuning the Profiler for efficiency, is certainly a realistic issue, but it's led us in many other directions, just as fruitful. Evaluate your testing and development needs, and derive one Profiler or many, each serving a purpose you've identified. Some of your needs will be incompatible with others, and other features can be combined in one interface. Whatever you want to do, the Visual FoxPro Coverage Profiler gives you the tools to do it.