About 30 years ago, in what often seems like a different galaxy, I wrote one book twice.
I had an excuse: my laptop was stolen, and with it all my notes and supporting code for the book, and my mostly-completed book text.
Please don’t give me sh*t for not having backups. I did have backups (floppies, naturally), but I was on a longish trip and the backups were with me. In the bag. With the laptop. As was the enormous modem (given to me by Glenn Hart!) that was my only method of jacking into CompuServe to curate FoxForum.
And please don’t give me sh*t about not sequestering a set of backups somewhere else. I should have, but I was pretty much living out of hotel rooms at the time, and not thinking clearly at all when I wasn’t thinking in code.
I’d like to think that my second version of that book was better than the first would have been, but it probably ain’t so. The first draft was inspired, the second draft was a tearful attempt to reconstruct and remember.
One of the things that didn’t make the book, possibly because I couldn’t find the code any longer and possibly because I had covered it in one of my very first FoxPro-related published articles, was snaking columns in a report. I have found the code now, SNAKEIT.ZIP (1.70 mb), if you’re curious. I’ve included a scanned version of probably the last existing copy of that article in the zip file, too. It’s all kind of a mess, and the code was a bear to write. I actually wrote it at 4 am DURING one of the earliest Fox DevCons. I don’t know why, but the snaking columns problem was something of an obsession for me at the time.
Like I said, another universe.
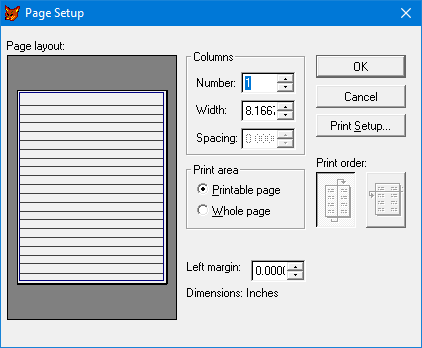
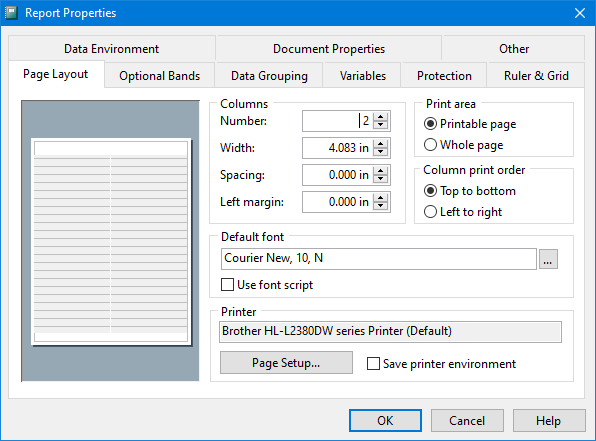
Then VFP came along and made the whole thing obsolete, bless it. This is one of the many places that FoxPro for Macintosh got there first, btw. In fact, the second layout for columns, going across first, was only ever implemented for fixed, rather than stretching bands, since otherwise labels would have screwed up. FPM implemented labels and reports exactly the same way, before this was true in the Windows/DOS world.
You can click on each image below for a closer look. It’s kind of pitiful that the only way I can even show you the FPM dialog is by taking a photo of a page from my own FPM book, long out of print. (Don’t ask me how FP-Unix did it, in its short, atrophied little life. )
Snaking Layout
|
VPF 5 through 8 –
|
Colin’s beautiful work
|
Equal and opposite
I have written about the opposite problem (“label orientation”, or across, then down) here in this blog, because my FoxPro code solutions just didn’t translate to an SSRS or T-SQL, at all. Obsession or not, and regardless of which layout you’re looking for, multiple columns are simply a real requirement, for real reports.
Then, this month, I had yet another RDL-based requirement for snaking columns and (no excuse this time except age) I had absolutely no memory of having solved a similar problem before, let alone having already written about it, in this blog. So, I solved it from scratch and I solved it better.
You probably have your own reasons for needing these specialized layouts; in my recent case, the report is serving as a giant lookup sheet of names and addresses. But for the purposes of illustration I’m going to use my standard SQL World database in my examples here.
Gee, what a difference a decade+ makes
This time, you won’t have to add a static number of left joins to hit the stated number of columns. This time, the user can specify the number of columns on the fly, in fact. From a SQL point of view, we’re using exactly the same tools — row_number() and modulus — as we used in 2007, just a little more flexibly. From an RDL point of view, we’re just going to let the tablix control and column groupings do… what they do.
2007Version.sql (776.00 bytes) SnakingColumnsinT-SQL_2020.sql (1.34 kb) SnakingColumns.rdl (41.47 kb)
We’ll do a walkthrough, first, and then consider whether we couldn’t just as well handle “across, then down” using the same idea, without hardcoding multiple joins, and a similarly user-specified number of columns.
Dynamic snaking columns walkthrough
The full code is available from the link above but I’m going to include it, here, and spell out the logic.
We’ll start by figuring out the number of rows we need, given the (this time) configurable number of columns.
Using this number of rows, we’ll get a temporary row index (imaginatively called RowIndexTemp) for each item, over the whole set. You’ll notice that we add 1 here after applying the modulus operator, because we don’t want a 0-based set of rows here. This is our innermost select (in the code, it’s got the alias “x”).
Now, within each temporary set of rows, we can get a temporary column index (again, imaginatively called ColumnIndexTemp) for each item in each row, partitioning by our temporary row index. Again, adding 1 to the result of the modulus operation. In the code, this nested select is aliased “y”.
We’ve divided our set of items into rows and columns, and we can now get a final RowIndex and ColumnIndex within each row, and within each column. In the code, this nested select is aliased “z”, although it could be the final step in many instances.
Finally, in this sample code, I have added a properly-sequenced ItemIndex with one more use of row_number(), ordering first by columnIndex and then by RowIndex, just because it makes the results easier to understand.
-- @Columns is a parameter to the report
declare @Rows as int

-- * 1.00 as Q&D way to make sure we get the fraction,
-- like the cast we used in the 2007 version.
select @Rows = ceiling(count(*) * 1.00 / @Columns)
from world.dbo.countrylanguage

select row_number() over (
    order by ColumnIndex
      ,RowIndex
    ) as ItemIndex
  ,*
from (
  select row_number() over (
      partition by RowIndexTemp order by Continent,CountryName,Language
      ) as ColumnIndex
    ,row_number() over (
      partition by ColumnIndexTemp order by Continent,CountryName,Language
      ) as RowIndex
    ,Continent,CountryName,Language,IsOfficial,Percentage
  from (
    select (
        row_number() over (
          partition by RowIndexTemp order by Continent,CountryName,Language
          ) % @Columns
        ) + 1 as ColumnIndexTemp
      ,*
    from (
      select (
          row_number() over (
            order by Continent,country.Name,Language
            ) % @Rows
          ) + 1 as RowIndexTemp
        ,Continent,country.Name as CountryName,Language,IsOfficial,Percentage
      from world.dbo.countrylanguage
      join world.dbo.country on countrylanguage.CountryCode = country.code
      ) x
    ) y
  ) z
It just feels right.
Yes, it’s a couple of nested selects. But no matter how many columns, or how many rows, you have, it’s never going to be more code or more nesting than this. The 2007 version of the code looked shorter but needed a new left join for each column.
The first proof of how “right” the code is, is how easy it is to create the report. There are a few nuances and niceties, but you’ve got everything in place for the tablix to do what it does best.
You create a tablix, set a row group on RowIndex and a column group on ColumnIndex, and that’s it.
Yes you can gussy it up — in large part, everything “just works”, because you haven’t done anything particularly clever to get the main result. In my sample report (also linked above), you’ll see:
- alternating column colors (
= iif(Fields!ColumnIndex.Value Mod 2 = 1, "AliceBlue", "WhiteSmoke")on the cells that make up the column group ) - special attention to the last cells if things don’t come out even (as they normally will not). This would not have been necessary if I hadn’t used an expression, rather than a dataset field, to represent the language percentage. That expression was
=iif(IsNothing(Fields!ItemIndex.Value),"",iif(Fields!Percentage.Value < 1.00, "<1", FormatNumber(Fields!Percentage.Value,0))).The IsNothing() in the external iif(…) is needed to handle those final cells. - column headers repeated on a new page and visible when scrolling. These are tablix-level native attributes, and for the life of me I can never understand why they are both counter intuitive to use and different when you’re using a tablix versus a table (in the latter case you have to use Advanced mode and set completely different properties to achieve the same result). But they do seem to work here. Mind, they work better, or more consistently, if you don’t use page headers at the same time (again, don’t ask me why).
Here’s the result, showing the very end of the report in 7 columns, so you can see all three types of the gussying up.
Across-then-Down
The second proof of how “right” the code is: Once you’ve done this, it’s child’s play to switch the orientation. I’m not going to re-narrate the logic because it’s really obvious, so here are the code and RDL bits:
AcrossThenDown2020.sql (1.35 kb)
Is it simple?
It’s not VFP-simple. You don’t just press a button in the page layout and you’re done. It’s tons simpler than what I did in that other galaxy, in FoxPro 2.x, and I think the result lends itself to a more flexible usage than any of my earlier methods.
That’s because it’s less of a kludge. So… I have a very strong feeling that something like this code is happening inside VFP and FPM.
And that’s the third proof of how “right” the code is.


One thought on “Déjà Vu all over again (or, how the Snake Ouroboros came home to roost)”