One of the fun things about my job is its constant exposure to collaborative tools and tricks I’ve never seen before.
Why collaboration is key for teachers
Teachers have a hard job, not the least because if they can’t make it exciting every day, they’re not going to shoehorn much into the heads of the kids in the class. To do this, they have to make it “new” for themselves, as well. They’re always looking for new ways to look at their material, and often that means inviting their peers and mentors in, adding eyes and thoughts.
If that weren’t enough, it often seems as though the best teachers treat their students as collaborators. Or maybe, depending on personality, as co-conspirators. Either way, the point is that ideas are shared, are built together, and the experience of learning builds on the give-and-take, not just the original lesson plan.
In our district, we have used moodle as a great way for experienced instructors to coach new teachers, and now it’s taking off for Distance Learning for students, as well. On both sites, the key is the collaboration fostered by the moodle environment, plus the ease with which people can construct and manage moodle content.
When the MySQL tutorial data is not enough
This week, looking for some new ideas for moodle add-in functionality, I found a list of web 2.0 apps in Campus Technology magazine . One of these tools also gave me a a great new way to gather sample reporting data: Factual.com.
Factual hosts what it calls a “living data ecosystem”, provided by its users and partners, enriched by data mining, aggregated and validated, and constantly improving. There are hundreds of thousands of datasets, in scores of categories (government, health, education, entertainment, etc). ‘
No matter what type of data I might need to illustrate a point, I’ll find it there.
What’s the catch?
You can download CSV files interactively from Factual, which is okay as far as it goes, but not very exciting when you’re thinking about sourcing data for reports in an application. But Factual also allows you to grab data, complete with filters and other options, using a simple URL/REST-ful API. That is perfect for my needs.
BUT. The data comes back in JSON… and JSON is not so perfect as a datasource for SSRS.
You may not dig Factual.com as much as I do, and you may not have to create sample datasets as often as I do… but I have a feeling you too will have reason to use JSON data at some point, and possibly want to analyze that data in an SSRS report…
So, I thought I’d share what I did to convert Factual json for use in SSRS reports. My conversion method is very simple, and easily decoupled from the particulars of my scenario. It would work for any data you downloaded in JSON but wanted to stuff into an RDL, I think.
Quick and dirty JSON-sourcing for SSRS
Here are the three steps I’ll take, with the details and samples of what the data looks like at each step, so you can envision what’s going on:
-
Grab the data from its source, whatever that happens to be. In my case, that’s Factual, and the JSON return from its read method looks like this, per http://wiki.developer.factual.com/w/page/29674488/Read:
Payload Field Description Examples fields array of field names data array of rows, each of which is an array of cell values [
[‘a’,’b’,’c’]
[‘e’,’f’,’g’]
]subject_columns Array of ordinals representing column(s) that make up the subject (primary key) of the table (the subject key can always be used to identify a row, but it can also be identified by subject label). This index begins at 1. [1] rows integer value of rows contained in the data object 20 total_rows integer value of total rows available in the table (with the given filter) … The example result I’m using in this post comes back looking like this:
{“response”:{“total_rows”:26607,”data”:[[“YD7oKcCyu9ImD7Ozbjiuo4xZlZs”,”000098da-9b1c-4ea2-8ea0-ccb666336009″,”24 7 Available Locksmith”,”5121 Onacrest Dr”,”Los Angeles”,”CA”,”90043″,”(323) 545-3363″], … more rows here …. ],”rows_is_estimated”:true,”fields”:[“subject_key”,”factual_id”,”name”,”address”,”locality”,”region”,”postcode”,”telephone”],”rows”:20,”cache-state”:”CACHED”,”big-data”:true,”subject_columns”:[1]},”version”:”2″,”status”:”ok”}
… and as you can see this doesn’t match RDL expectations as-is, no matter how useful the data is. Onward!
-
Use Json.NET library (on codeplex, from NewtonSoft — visit http://james.newtonking.com/projects/json-net for more info) to transform the JSON source to an XML equivalent. No matter what your JSON format and characteristics, and this depends on your source, you need to do a test to see what the conversion will give you. In my case, each row appears as an element within a response element, with each column as a nested data element in a strict sequence. After all data rows appear, there is a set of fields elements, each one showing a column name for the data columns, and in the same sequence. It looks something like this:
<root>
	<!-- raw result from Newtonsoft.Json -->
	<response>
		<total_rows>26607</total_rows>
		<data>
			<data>YD7oKcCyu9ImD7Ozbjiuo4xZlZs</data>
			<data>000098da-9b1c-4ea2-8ea0-ccb666336009</data>
			<data>24 7 Available Locksmith</data>
			<data>5121 Onacrest Dr</data>
			<data>Los Angeles</data>
			<data>CA</data>
			<data>90043</data>
			<data>(323) 545-3363</data>
		</data>
		<!-- ... more <data/> elements here ... followed by: -->
		<rows_is_estimated>true</rows_is_estimated>
		<fields>subject_key</fields>
		<fields>factual_id</fields>
		<fields>name</fields>
		<fields>address</fields>
		<fields>locality</fields>
		<fields>region</fields>
		<fields>postcode</fields>
		<fields>telephone</fields>
		<rows>20</rows>
		<cache-state>CACHED</cache-state>
		<big-data>true</big-data>
		<subject_columns>1</subject_columns>
	</response>
	<version>2</version>
	<status>ok</status>
</root>
- Transform the XML you got in the last step to something ADO-shaped. My XSLT for this is simplicity itself. I’m creating attribute-centric rows, because they’re a little more compact, but you can make them element-centric if you prefer (just change the <xsl:attribute> to <xsl:element>). Each attribute (or element) is deriving its name from the corresponding field or column name that we got from the JSON fields collection:
<?xml version="1.0" encoding="utf-8"?>
<xsl:stylesheet version="1.0" xmlns:xsl="http://www.w3.org/1999/XSL/Transform">
    <xsl:output method="xml" omit-xml-declaration ="yes"/>

  <xsl:variable name="cols" select ="/*/response/fields"/>

  <xsl:template match="/">
    <Rows>
      <xsl:apply-templates select="/*/response/data"/>
    </Rows>
  </xsl:template>

  <xsl:template match="response/data">
    <Row ID="{count(preceding-sibling::*)}">
    <xsl:for-each select ="./data">
      <xsl:variable name="pos" select ="position()"/>
      <xsl:attribute name="{$cols[position() = $pos]}">
        <xsl:value-of select="."/>
      </xsl:attribute>
    </xsl:for-each>
    </Row>
    </xsl:template>

</xsl:stylesheet>
… and the result looks pretty much like you would expect, very generic, kind of boring, but okay for an RDL dataset:
<Rows>
<Row ID="1"
   subject_key="YD7oKcCyu9ImD7Ozbjiuo4xZlZs"
   factual_id="000098da-9b1c-4ea2-8ea0-ccb666336009"
   name="24 7 Available Locksmith" address="5121 Onacrest Dr"
   locality="Los Angeles" region="CA" postcode="90043"
   telephone="(323) 545-3363" />

  <!-- ... lots more <Row/> elements here ... ending with: -->

</Rows>
How’s that again?
Here are the gory details of HOW to take the steps I just listed, in their code-ish entirety, as I wrote them in an ASP.NET page method.
If you don’t count a couple of import statements to reference standard .NET libs plus Newtonsoft.Json, this is absolutely all the code there is behind my simple little web service-y page, and wherever you decided to house the code, it would look about the same, or even simpler (because you might not need the a Response-specific flushing and closing):
Dim jsonText As String
‘ I’ll be getting this directly from factual.com
Dim client As New WebClient (), url As String
‘ First, decide where to get the data you want:
url = “http://api.factual.com/v2/tables/YourTableID/read?APIKey=YourApiKey”
‘ To build this url properly in an app, we might have to parse incoming variables
‘ and fashion a querystring on the URL rather than just pasting in a literal as shown here
‘ Once the url is built, get the data:
json = client.DownloadString(url)
‘ Now get xml from Factual’s JSON response:
Dim doc As XmlDocument= _
CType(JsonConvert.DeserializeXmlNode(jsonText, “root”), XmlDocument)
‘ Convert the json-based XML according to what Newtonsoft will do,
‘ to ADO-shaped XML, very generically :
Dim xsl As New XslCompiledTransform(), result As New StringWriter()
xsl.Load(Server.MapPath( “NewtonsoftStyleFactual.To.AdoStyleFactual.xslt”))
‘ I should be caching this, it will always be the same
xsl.Transform(doc, Nothing, result)
result.Close()
result.Flush()
‘ … And the result you’ll send back will be usable in a report:
Response.ContentType = “application/xml”
Response.Write(result.ToString())
Response.Flush()
Response.End()
End Sub
How does the report “read” it?
If you’re just playing around with sample data, you can do most of this interactively in Visual Studio — I’ve written elsewhere about how to use Visual Studio or other tools to do the XSLT transform part. If you’re going to do it repeatedly, you can incorporate the code you see above, including the Newsonsoft translation, into a small executable that takes a couple of parameters, so that you can easily create a sample data set in easy-to-use XML form for reporting in a couple of seconds.
Once you have that XML content available, you can actually embed the full XML document into the RDL if you want. This is a good idea if you’re just playing around with a new JSON-based data source. The XML goes, strangely enough, directly into the Query Builder — there’s an entry in the docs titled XML Query Syntax for Specifying XML Report Data that provides an example. Basically you put XML similar to what we’ve created inside the following nodes, written right into the Query Builder in place of a SQL statement or reference to a code function:
<XmlData>
<!– our entire XML data document goes here –>
</XmlData>
</Query>
If you’re using an RDLC, it’s even easier, even if this is production work rather than a “play-round”. You can easily load the final product of the code in the method above into a dataset, and hand that dataset to a report, in whatever type of application is doing the rest of your work and hosting the reportviewer control. You can read here for one of my examples of dynamically creating a datasource for a local report — or just go to http://gotreportviewer.com, and learn about local reports from the ground-up.
If you’re using an RDL, and if this is a production app, obviously you are not going to embed the XML data into the RDL the way you did for tests; there will be parameters, and the data will be live and dynamic. You have to use a “real” xml data source now.
This part will take a little more work than you’re used to, when pulling data from a “real” relational database, but only a little.
If you’re in Visual Studio 2008, I found that (besides manually editing the XML), it was best to start off creating the report in Report Builder; Report Designer had a couple of nasty bugs as you create and configure the data source. After I got through that initial work, I couldn’t layout and preview the RDL in Report Builder, because it wasn’t happy with the authentication requirements for the XML Data Source, even though it created the darn thing. However, I could save the RDL to disk, and I was then able to design the report layout, and preview it properly, using Report Designer in Visual Studio 2008.
Here’s what you do.
| First, as Steve Martin would have said, give the RDL a new XML data source. I mean, the TYPE of the connection is XML. Seems obvious, but I can’t tell you how many times I’ve done the next step and not noticed that the stupid drop down reverted to SQL Server while I wasn’t looking. | 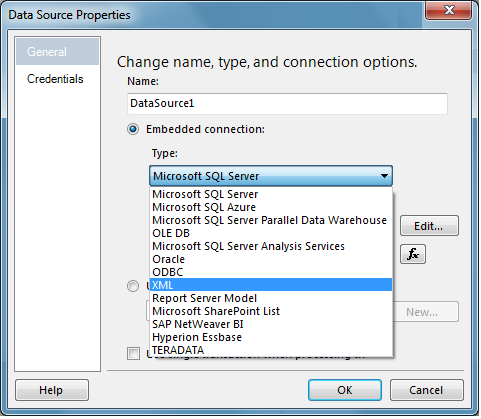 |
| The connection string for your new data source is going to be the URL for the web-service-y little ASP.NET page you’ve constructed to go get your data. | 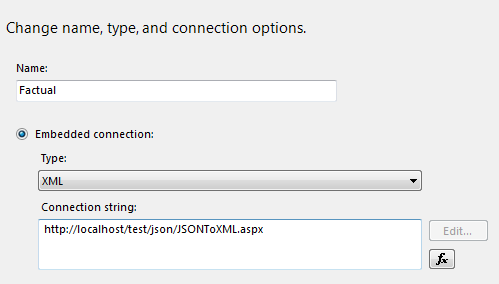 |
|
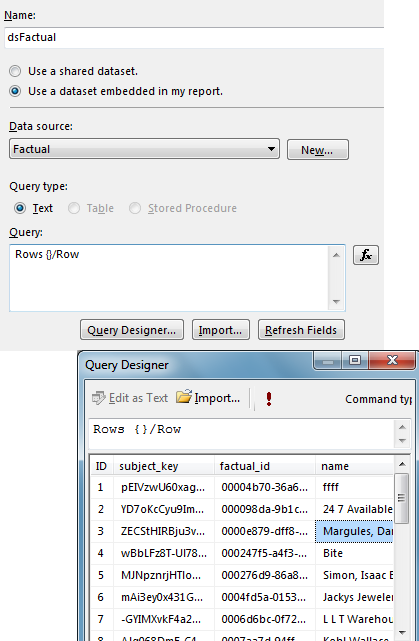
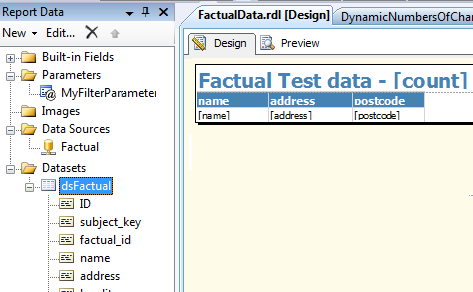
Now create a dataset using this data source. Your “Query” will be a strange-looking XPATH-y expression, that basically drills down from the root node (mine is “Rows”) to the datarow-level element I want for each row in the result (mine is “Row”). For more info, search for Element Path Syntax for Specifying XML Report Data in the docs.
When you press the “Refresh Fields” button, nothing will appear to happen — but the Dataset will, in fact, get its fields collection. You can verify this by going into the Query Designer window; you’ll see your data. Make sure you do this before trying to set up the connection as an expression (see next step).
|
 |
| Don’t forget that the “connection string” (aka URL) can be an expression. You’ll need this if you are going to pass some filtering or limiting instructions, or other options, to the JSON source, as I will for Factual. | 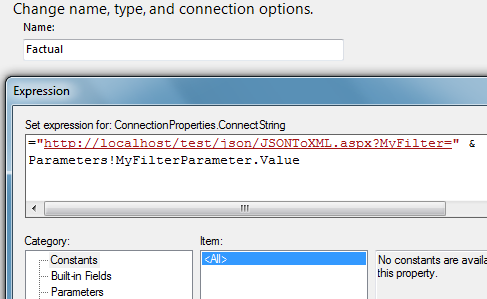 |
If you use an expression right away (before building your fields collection for the dataset), you’ve made it difficult for the Report Designer to cache some data for layout purposes; you’ll get an error and you’ll have to manually create your fields collection, which can be done but is a PITA.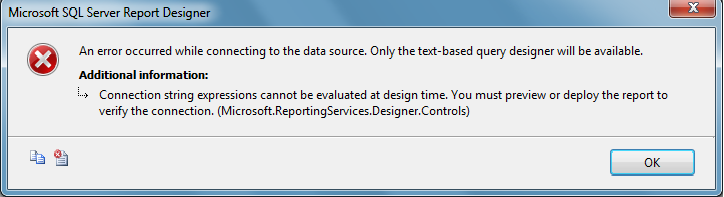 |
|
| It’s a little extra trouble, but that’s it!
Afterwards, you just use the data set and design the report as you normally would. |
 |
It’s definitely worth it
Almost anything I could ever want for sample data — and a lot I’d want for production BI reference use as well — can be found at Factual.com. And I’ll never have to write another line of code to convert it again, except for whatever intelligent parameters, specific to each data set, I might want to expose and pass back in the URL.
As a corollary, almost any kind of data, besides JSON, could be expressed as XML using the same methodology and “thrown” over the fence to an RDL using an XML data source, with no additional code being written.
What do you think? Fun, or what?
C’mon. If you like data and reports, you gotta say *yeah*.