
By Colin Nicholls and (minorly) Lisa Slater Nicholls
September 2007
In previous versions of Visual FoxPro, the closest you could get to a custom control in the Report Designer would be some sort of OLE/Bound control, which was limited to the kinds of object data that could be embedded into a FoxPro General field.
In VFP 9.0 SP2 the range of choices has been opened up, and many more possibilities are available to the creative developer.
In these notes, we will first take a look at the power of the AdjustObjectSize method of reportlisteners, and how that power has been exposed for easy use in the Report Builder in SP2. Then we'll employ the capabilities of GDI+ to draw directly on the print canvas to create a true, data driven custom report control.
Bar Chart using Shapes and AdjustObjectSize
For this first example, we're going to use some nice test data consisting of monthly underwater temperature readings in locations around Australia. The source web site is http://www.diveoz.com.au/temperatures/default.asp.
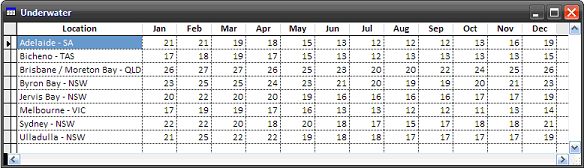 Figure 1. Underwater temperature data |
We can simulate a bar graph by using a colored shape element for each month of the year, and use the new Dynamics tab in the Shape Properties dialog box to specify the height of the shape using the default report listener's AdjustObjectSize method.
Alas, it is not quite that simple. Although the AdjustObjectSize method allows us to change the height of the shape, it does not affect the top position. We either have to accept an inverted bar chart (one with the bars hanging down from the top of the report band) or we must resort to a trick. The trick is to overlay a second opaque shape and control its height using dynamic sizing.
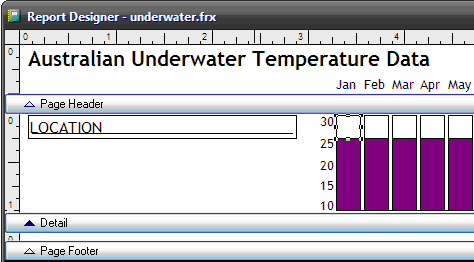 Figure 2. A second shape is used to control the height of the bar using white space |
So each bar in the chart is comprised of two shapes- the colored bar, and the white space above it. The colored bar is 1 inch in height. We need to develop an appropriate dynamic expression to set the height of the white space shape.
Given that the temperature values in our data set range from 10 to 30 degrees, and the expression must evaluate to units of 960 dots per inch, one suitable expression would be the following:
960 - int(960/20 * (temperature-10))
A temperature of 10 degrees will result in the white space completely covering the colored bar. (We could easily extend the range down to 0 and remove the -10 constant from the expression...)
In a production environment you should include data range analysis and bounds checking in developing a suitable expression. Obviously we don't want it to resolve to a negative value!
For each bar (each month) in the chart, we will open the Rectangle Properties dialog for the white space shape, select the new Dynamics tab, and add a condition.
It doesn't matter what the condition is called — the important thing is to enter .T. for the Apply when condition is true expression so that the dynamic behavior is always applied to the shape.
Then we enter our Height Expression as determined above.
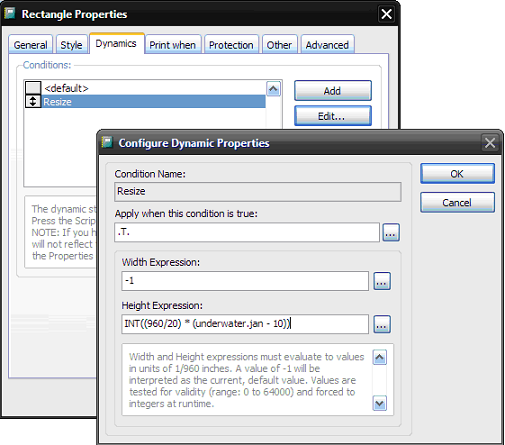 Figure 3. Entering the dynamic expression for the height |
We must adjust the table column in the expression as we adjust the properties for each month's shape.
We leave the Width expression as -1, which will leave the rectangle width unchanged from its default value in the Designer.
After saving the report, if you have ensured you are using the ReportOutput.App from VFP 9.0 SP2 and you have SET REPORTBEHAVIOR 90, you should be able to see the results immediately in a preview window:
After saving the report, if you have ensured you are using the ReportOutput.App from VFP 9.0 SP2 and you have SET REPORTBEHAVIOR 90, you should be able to see the results immediately in a preview window:
_REPORTOUTPUT = "\<VFP9sp2>\ReportOutput.APP"
SET REPORTBEHAVIOR 90
REPORT FORM underwater PREVIEW
The preview shows how you can see the temperature drop during the winter months of the Southern hemisphere.
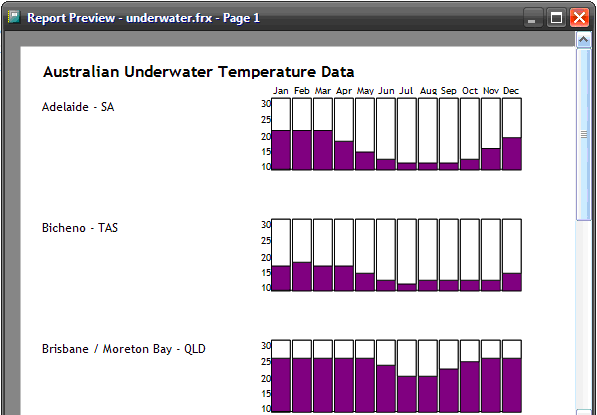 Figure 4. Bar charts composed of Shape layout elements |
Wouldn't it be nice if we could also change the color of the bar chart based on the temperature value? Unfortunately, VFP 9.0 SP2 does not provide a DynamicBackColor for Shapes, but as we shall see in the next section, it does give us all the tools we need to implement this ourselves.
A Custom Control using the GFX Collection
One of the many new features in VFP 9.0 SP2 is a revised class hierarchy in the FFC\_reportlistener.vcx class library.
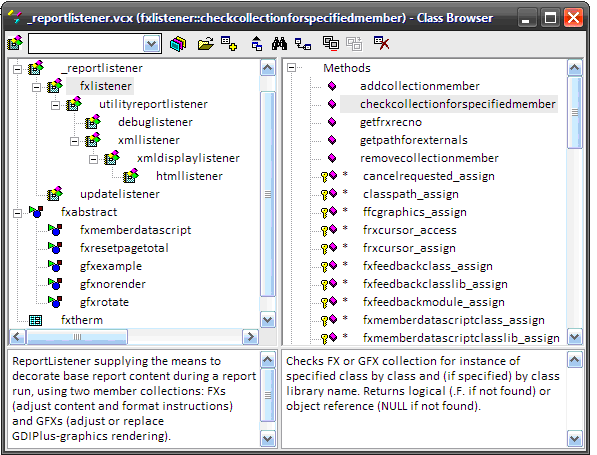 Figure 5. The class hierarchy in FFC\_reportlistener.vcx |
Introducing FXListener and FXAbstract
A new derived class, FXListener, includes a framework that lets us add custom rendering to report layout elements through a minimum of additional code. This framework consists of two user-defined collections of helper objects: the FX collection, for content and formatting adjustments; and the GFX collection, for GDI+ graphics rendering adjustments. As you may have guessed, "FX" stands for "effects".
Every reportlistener class provided by default for each main output type is descended from FXListener, gaining this new functionality.
FXListener class
FXListener implements some utility methods for leveraging the helper object collections, including AddCollectionMember() and RemoveCollectionMember().
FXAbstract class
If you examine the _reportlistener library in the Class Browser further, you will notice a separate hierarchy descended from a new class, FXAbstract. This class defines the required API of objects that may be added to FXListener's helper collections. Some sample helper objects descended from FXAbstract are included in the library. Each of them implements the required API: a method called ApplyFX().
FXAbstract:: ApplyFX( )
As the report run proceeds, for each listener method, FXListener will iterate through its helper object collections, invoking ApplyFX() on each object. To effectively respond to this process, ApplyFX must support a comprehensive and varying parameter list, consisting of:
- an object reference to the listener itself;
- the name of the listener event currently executing (as returned by PROGRAM());
- 12 placeholder parameters, one for each possible parameter passed to the listener event.
The integer value returned by ApplyFX is important, because it will affect the native rendering of the report element performed by the report engine and/or reportlistener:
- 0. The element will be rendered after the restoration of the GDI+ co-ordinate system.
- 1. The element will be rendered before the restoration of the GDI+ co-ordinate system (e.g. Rotation).
- 2. The element will not be rendered at all.
Any return value other than 1 or 2 will be interpreted as 0. Because multiple FX objects in the collection may be invoked by FXListener, the final rendering effect will be cumulative, i.e. only one FX object needs to return 2 in order for the layout element to be suppressed from rendering at all.
So, after all that theory, let's take a look at an example. We're going to keep it simple, and use a GFX helper object to render a colored rectangle.
Our Test Report
As a test case, we will use a simple report displaying sample data from CUSTOMER.DBF.
For reasons that will become apparent below, this report also features an element that has had rotation and dynamic styling applied to it: the "CONFIDENTIAL" text will appear transparent and slanted at an angle across the top of the report, simulating an "ink stamp".
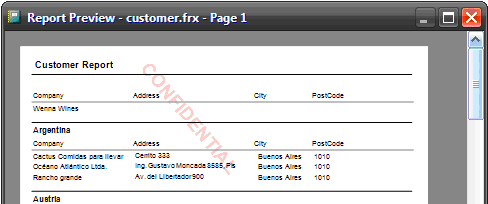 Figure 6. A preview of CUSTOMER.FRX with rotated, transparent text |
There's space in the detail band for a placeholder rectangle to be added on the right side. We're going to be filling the rectangle with a color derived from the CUSTOMER.MAXORDAMT column.
Example 1: Placing custom code into the rendering process
In EXAMPLE.PRG, we're going to create a programmatic class, MyRender, implementing ApplyFX(), that we can add to an FXListener's GFX collection in order to add custom rendering code into a report run.
DEFINE CLASS MyRender
...
ENDDEFINE
Using GDI+ to paint on the report canvas
Before we flesh out the details of the ApplyFX method, let's look at the Colorize() method that will actually do the drawing. This session is not going to cover advanced use of the GDI+ API, but fortunately, we can use the _gdiplus.vcx FFC library to encapsulate the intricate details. Below we can see the commands required to fill a rectangle with a color. Note the expression used to derive the RGB value from the customer column:
LPARAMETERS toListener, tiLeft, tiTop, tiWidth, tiHeight

LOCAL gdiBrush, gdiColor, iRGB

iRGB = INT(MTON(customer.maxordamt))

gdiBrush = NEWOBJECT( "gpSolidBrush", HOME()+"FFC\_gdiplus.vcx")
gdiColor = NEWOBJECT( "gpColor",      HOME()+"FFC\_gdiplus.vcx")
gdiBrush.Create()
gdiColor.FoxRGB = iRGB
gdiBrush.BrushColor = gdiColor.ARGB

toListener.FFCGraphics.FillRectangle(gdiBrush, tiLeft, tiTop, tiWidth, tiHeight)
Several points to note about this otherwise pretty straightforward code:
- Two helper objects from the _gdiplus.vcx are used: gpBrush and gpColor.
- The gpColor object is used to convert our RGB value into ARGB format. GDI+ requires an additional byte representing the "alpha channel" or transparency.
- The gpBrush object is used to fill spaces with color (or patterns, but that's another session.)
- The FFCGraphics property is defined by the FXListener class. It is not a new base class property.
About the FFCGraphics property
The FXListener class defines a number of additional properties and methods over those defined by the base reportlistener class. FFCGraphics is an object reference to an instance of a third class that must be derived from a class defined in _gdiplus.vcx: gpGraphics. If it hasn't already been assigned an object reference, gpGraphics is instantiated during the report run and made available to members of the GFX collection. You can think of this object as the Artist standing in front of the canvas and performing the actual drawing. GFX members can invoke its methods, performing additional rendering on the report canvas.
Performing the rendering with ApplyFX ()
For our rectangle, we are only interested in running code during the listener's Render event, so our implementation of ApplyFX needs to examine the method token (passed as the second parameter) and restrict its operation:
LPARAMETERS toListener, tcMethod, ;
            p1, p2, p3, p4, p5, p6, p7, p8, p9, p10, p11, p12

DO CASE
CASE tcMethod = "RENDER"
	THIS.Colorize( toListener, p2, p3, p4, p5 )
      RETURN 2
ENDCASE
We return a value of 2 from the method because we wish to suppress the native rendering of the placeholder shape, as described earlier.
Running the example
In order to run the example, we need to add it to the listener's GFX collection using the method AddCollectionMember():
Here are the steps:
ox = NEWOBJECT("FXListener", HOME()+"FFC\_reportlistener.vcx" )
We set ListenerType=1 because we wish to preview the report.
ox.ListenerType = 1
We use AddCollectionMember to put our class into the GFX collection:
? ox.AddCollectionMember( "MyRender", "example.prg", "", .T., .T. )
        1
If we try and add our object a second time, we won't be able to, due to our use of TRUE as the lSingleton parameter:
? ox.AddCollectionMember( "MyRender", "example.prg", "", .T., .T. )
        0
REPORT FORM customer.frx OBJECT ox
What went wrong?
Every layout element in our report was replaced by a colored rectangle!
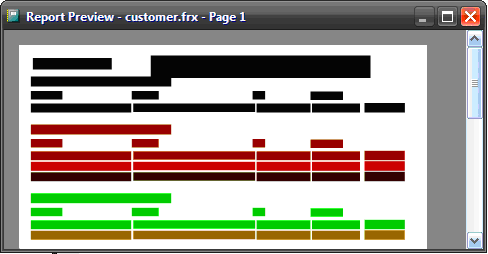 Figure 7. What went wrong? |
In hindsight this is obvious: we attached our custom rendering code to every render event, so all report elements received the benefit of our data-sensitive paint job.
Obviously we need to distinguish the layout element to which we apply our render code.
Adding an Advanced Property to the element
We can make our placeholder rectangle stand out from the other report elements by assigning an advanced property to it, using a new feature of the Report Builder application in VFP 9.0 SP2.
Report layout elements have an Advanced tab where, in addition to pre-defined properties, you can add your own.
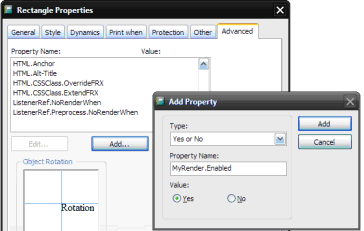 Figure 8. Adding a Boolean advanced property called "MyRender.Enabled |
We will add an advanced property called MyRender.Enabled. Given that the format of the report layout source file (.FRX or .LBX files) has still not changed from previous versions of Visual FoxPro, where are these new properties stored? The answer is memberdata.
Memberdata
If you USE the report as a table and browse, you'll notice that some records have contents in the STYLE column. STYLE is a memo field.
<VFPData>
	<memberdata name="Microsoft.VFP.Reporting.Builder.AdvancedProperty"
       type="R" script="" execute="1" execwhen="MyRender.Enabled"
       class="" classlib="" declass="5" declasslib=""
       width="" height=""/>
</VFPData>
The Report Builder encodes the advanced property values using the VFP9 Memberdata XML schema. The schema of VFP memberdata is documented quite thoroughly in the help file under the topic MemberData Extensibility. (See the help topic Report XML MemberData Extensions for additional details.)
As we shall see below, thanks to FXListener, this information is readily available to our code at runtime, without our having to write any special XML-handling code. We can see this more clearly if we suspend the report run and take a look around at the environment.
Debugging the report run data sessions
The best point to suspend at is the reportlistener's BeforeBand event. We can use the Debugger's Watch window to set the break point and examine properties of the listener.
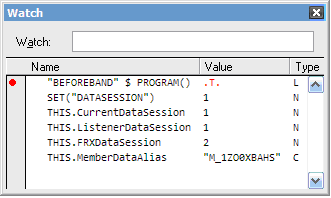 Figure 9. Suspending at the listener's BeforeBand event |
The number of data sessions that a reportlistener must be aware of may surprise you:
- The one that the Listener class was instantiated in (.ListenerDataSession);
- The one containing the data driving the report (.CurrentDataSession);
- The one managed by the listener itself containing the FRX cursor (.FRXDataSession).
Some of these data sessions may be shared, and the data session that the REPORT FORM command was executed in may or may not be one of them. This becomes more apparent when the report layout has been configured to use a private data session of its own.
The MEMBERDATA cursor
FXListener uses the XMLTOCURSOR() function to create a memberdata cursor with a record for each report layout element that has it. This cursor is open in the same data session as the reference copy of the report FRX. Detecting our advanced property becomes as simple as changing data sessions and locating records in a cursor.
The primary key of the memberdata cursor is FRXRECNO, an integer column that contains the RECNO() of the record in the FRX cursor corresponding to the same report layout element. This makes it easy to look up member data. See also the FxListener utility method GetFrxRecno().
FXListener uses a unique, generated alias for the memberdata cursor, and exposes it in the .MemberDataAlias property. While suspended in the listener event, we can examine the memberdata cursor with the following commands:
SET DATASESSION TO THIS.FRXDataSession
SELECT (THIS.memberDataAlias)
LOCATE FOR frxrecno = RECNO("frx")
BROWSE
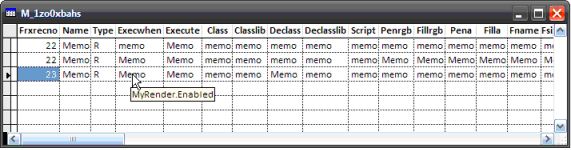 Figure 10. The memberdata cursor |
Although we only added an advanced property to our placeholder rectangle, you will notice that there are two other records in the memberdata cursor that belong to a different layout element. You may deduce that these records contain the instructions to decorate the "CONFIDENTIAL" text, rotating and making it transparent.
A quick scan across the fields with the mouse will reveal the column values via tooltips:
- NAME contains "Microsoft.VFP.Reporting.Builder.AdvancedProperty";
- EXECWHEN contains the name of the advanced property, "MyRender.Enabled";
- EXECUTE contains the value, "1", representing true.
See Appendix A for more details on how the memberdata attributes are used by the various new features (such as dynamic formatting) in the VFP 9.0 reporting system.
Example 2: Exercising restraint
EXAMPLE2.PRG implements a revised version of our GFX helper class:
- We've added an Init() method, and created the two GDI+ helper objects "up front" as members of the class rather than temporary instances created "on the fly". This will make the class more efficient, and simplify the Colorize() method;
- We have an .Enabled property;
- We've implemented a new method to check for the MyRender.Enabled advanced property that we added to our placeholder rectangle above;
- We've made the Colorize() method look for the CUSTOMER table in the appropriate data session;
- We're also using some #DEFINE constants for readability.
Checking for the advanced property
Our class will have a new method, CheckForMyRender(), to return true if the advanced property MyRender.Enabled is present and set.
First we need to switch to the correct data session:
LPARAMETERS toListener, tiCurrRecno

iCurrSession = SET("DATASESSION")
SET DATASESSION TO toListener.FRXDataSession

IF USED(toListener.MemberdataAlias)
	SELECT (toListener.MemberdataAlias)
It's simply a matter of looking for the memberdata records that represent our placeholder element (via the record number) and our advanced property:
	LOCATE FOR ;
		TYPE     = FRX_BLDR_MEMBERDATATYPE          AND ;
		NAME     = FRX_BLDR_NAMESPACE_ADVANCEDPROPS AND ;
		FRXRECNO = tiCurrRecno                      AND ;
		EXECWHEN = "MyRender.Enabled"

	IF FOUND() AND EXECUTE = '1'
		THIS.Enabled = .T.
	ELSE
		THIS.Enabled = .F.
	ENDIF
ELSE
	THIS.Enabled = .F.
ENDIF
Then we can restore the data session (important!) and return a logical value indicating whether our rendering code is required:
SET DATASESSION TO (iCurrSession)
RETURN (THIS.Enabled)
Revising ApplyFX()
The ApplyFX() method now becomes:
DO CASE
CASE tcMethod = "RENDER"
	IF THIS.CheckForMyRender( toListener, p1 )
		THIS.Colorize( toListener, p2, p3, p4, p5 )
      		RETURN OUTPUTFX_BASERENDER_NORENDER
	ENDIF
ENDCASE
Revising Colorize()
The Colorize() method also needs some revision: it needs to be aware of data sessions (so that it can data-drive the RGB value); and it no longer needs to create the GDI+ helper objects:
LPARAMETERS toListener, tiLeft, tiTop, tiWidth, tiHeight

LOCAL mySession
mySession = SET("DATASESSION")
SET DATASESSION TO (toListener.CurrentDatasession)

LOCAL iRGB
iRGB = INT(MTON(customer.maxordamt))

SET DATASESSION TO (m.mySession)

THIS.colorHelper.FoxRGB = m.iRGB
THIS.brush.BrushColor   = THIS.colorHelper.ARGB

toListener.FFCGraphics.FillRectangle( THIS.brush, ;
                                      tiLeft, tiTop, tiWidth, tiHeight)
Running the example
In order to run the revised example, we first need to unload the previous version, using another method of FXListener, RemoveCollectionMember():
Here are the steps:
? ox.RemoveCollectionMember("MyRender",.T.,.T.)
  .T.
? ox.AddCollectionMember("MyRender","example2.prg","",.T.,.T.)
        1
REPORT FORM customer OBJECT ox
Now only our placeholder rectangle should be filled with color.
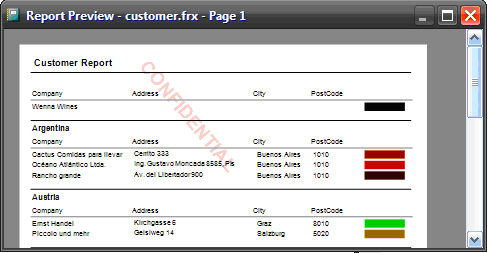 Figure 11. The revised GFX helper object in action |
Adding to the Default Advanced Properties
It'd be nice if we could add our custom advanced properties to the list in the Report Builder dialogs, without having to add them explicitly every time. How is this possible? By adding records to the report builder's configuration table.
RECAP: The Report Builder's Configuration Table
The Report Builder's Handler Registry Table started out life in VFP 9.0 as a table for registering builder event handler classes. In SP2, it has been extended to other configuration duties such as the registration of additional UI panels in builder dialogs, and also the definition of advanced properties.
Obtaining an editable copy
We saw how to obtain an editable copy of the configuration table earlier.
Editing the configuration
The Registry Explorer button in the Report Builder's Options dialog displays the configuration table in a browse-able view.
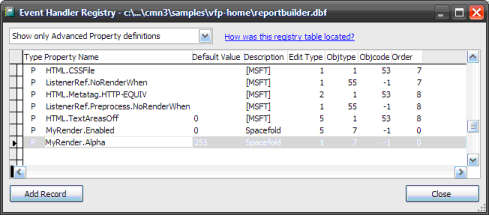 Figure 12. The Event Handler Registry Explorer |
Adding new property definitions
Now that the configuration table is editable, we can add our own advanced property definitions. Begin by changing the category combo list to Show only Advanced Property definitions.
Add the following records using the Add Record button:
| Type | Name | Default Value | Edit Type | ObjType | ObjCode | Order |
|---|---|---|---|---|---|---|
| P | MyRender.Enabled | 0 | 5 | 7 | -1 | 9 |
| P | MyRender.Alpha | 255 | 5 | 7 | -1 | 9 |
Here we are limiting the visibility of the properties to Shape/Rectangle layout elements (that's OBJTYPE = 7). See Appendix C for the range of possible values for these columns.
Revising CUSTOMER.FRX to use the advanced properties
Now that our code is looking at a different set of advanced properties, we need to revise the report layout so that our placeholder rectangle is using them. We should see our new default properties show up in the builder's Rectangle Properties dialog.
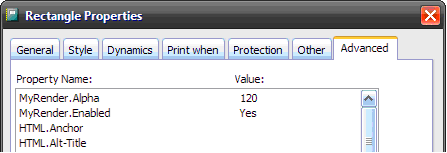 Figure 13. Setting the properties on the placeholder rectangle |
We'll try setting MyRender.Alpha=120 (roughly 50% transparency).
How Advanced Properties are stored in the FRX
Advanced Properties make use of the standard elements in the memberdata XML thusly:
| Element/Column | Contents |
|---|---|
| TYPE | 'R' |
| NAME | 'Microsoft.VFP.Reporting.Builder.AdvancedProperty' |
| EXECWHEN | Property.Name |
| DECLASS | Property.DataType |
| EXECUTE | Property.Value |
See Appendix A for more details on reporting memberdata and how these columns are used by different namespaces.
Example 3: Getting efficient
In addition to demonstrating default advanced properties, we're also going to revise our example further to demonstrate the use of the alpha channel value, and make it more efficient again. EXAMPLE3.PRG differs from EXAMPLE2.PRG in the following ways:
- It queries the memberdata cursor once "up front" for our advanced properties, and indexes it for speed. We use our own unique, generated cursor alias for this.
- It is aware of the MyRender.Alpha property that we added above.
- It saves the data session IDs to class member properties for quick and easy reference.
Querying the memberdata
The first difference is we have extended the main ApplyFX() method to handle the reportlistener's BeforeReport event as well:
CASE tcMethod = "BEFOREREPORT"
	THIS.frxSession = toListener.FRXDataSession
	THIS.dbfSession = toListener.CurrentDataSession
	THIS.QueryMemberdataUpFront( toListener )
The BeforeReport() event is invoked by the report engine once at the beginning of the report rendering process, ideal for once-up-front initialization code. Here, we save the two data session IDs to class member variables, and call a new class method, the creatively-named QueryMemberDataUpFront():
LPARAMETERS toListener

SET DATASESSION TO (THIS.frxSession)

IF USED(toListener.MemberdataAlias)
	SELECT (toListener.MemberdataAlias)

	SELECT frxrecno, execwhen AS propname, execute AS propvalue ;
	  FROM (toListener.MemberdataAlias) ;
	  INTO CURSOR (THIS.myCursor) ;
	  WHERE type = FRX_BLDR_MEMBERDATATYPE          AND ;
	        name = FRX_BLDR_NAMESPACE_ADVANCEDPROPS AND ;
	        LEFT(execwhen, 9) == 'MyRender.'        AND ;
	        NOT EMPTY( execute )

	IF USED(THIS.MyCursor)
		IF RECCOUNT(THIS.MyCursor)=0
			USE IN (THIS.MyCursor)
		ELSE
			SELECT (THIS.MyCursor)
			INDEX ON TRANSFORM(frxrecno)+PADR(propname,25) TAG temp
		ENDIF
	ENDIF
ENDIF

SET DATASESSION TO (THIS.dbfSession)
The method is straight-forward, selecting only the advanced properties that apply to our object, and indexing it for speed.
The PADR(propname,25) is a kludge to allow us to index the EXECWHEN memo field without encountering the dreaded error 2199.
Revising CheckForMyRender()
With this cursor at our disposal, we can improve our CheckForMyRender() test code:
LPARAMETERS tiCurrRecno

SET DATASESSION TO (THIS.frxSession)

IF USED( THIS.myCursor) AND ;
   SEEK( TRANSFORM(m.tiCurrRecno)+"MyRender.Enabled", THIS.MyCursor )

	SELECT (THIS.MyCursor)
	THIS.Enabled = (propvalue='1')

	IF SEEK( TRANSFORM(m.tiCurrRecno)+"MyRender.Alpha", THIS.MyCursor )
		THIS.Alpha = VAL( propvalue )
	ELSE
		THIS.Alpha = 255
	ENDIF
ELSE
	THIS.Enabled = .F.
ENDIF
SET DATASESSION TO (THIS.dbfSession)
RETURN (THIS.Enabled)
Instead of using LOCATE through the full memberdata set, we can do a quick SEEK() in a specialized subset. We are grabbing the Alpha channel property at the same time, saving it into a class member variable, THIS.Alpha.
Revising Colorize() to use the Alpha Channel
So how does our actual rendering code in Colorize() change? The FFC GDI+ helper object gpColor is a bit obstinate when it comes to including an alpha channel value. We have to feed it separate R,G,B,A values in order for it to return the correct brush color:
:
THIS.colorHelper.Set( MOD( iRGB,256 ), ;
                      MOD( INT(iRGB/256),256), ;
                      MOD( INT(iRGB/(256*256)),256), ;
                      THIS.Alpha )

THIS.brush.BrushColor = THIS.colorHelper.ARGB

toListener.FFCGraphics.FillRectangle( THIS.brush, ;
                                      tiLeft, tiTop, tiWidth, tiHeight )
:
Running the example
We follow the same steps as in the previous example, switching from EXAMPLE2.PRG to EXAMPLE3.PRG:
? ox.RemoveCollectionMember("MyRender",.T.,.T.)
  .T.
? ox.AddCollectionMember("MyRender","example3.prg","",.T.,.T.)
        1
REPORT FORM customer OBJECT ox
Now our placeholder rectangle should be transparent.
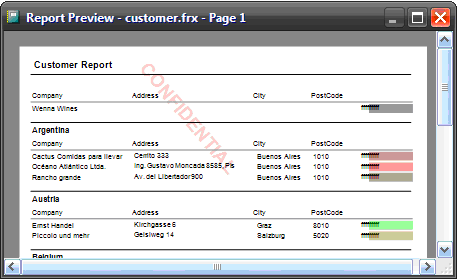 Figure 14. The revised GFX helper object in action |
Adding control panels to the Report Builder
This is all very well but we all know what we really want to do. We want to add our own custom control panel to the Report Builder, and use form controls instead of those advanced properties. But first, let's look at how to better leverage the memberdata.
Aside: Viewing memberdata in the Report Builder
Remember that Report Builder layout element properties are stored in the STYLE column of the FRX source table, using an XML schema.
To make things easy, the Report Builder's context menu includes an option to view or edit the memberdata for any layout element, including the report "header" itself.
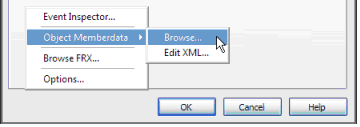 Figure 15. The Report Builder's context menu exposes memberdata |
We have two options:
- Edit the XML directly as text
- Browse the memberdata in cursor form
The Browse... option is only enabled if there is, in fact, some memberdata associated with the select layout element. It is useful because it displays how you will probably want to read the information from the memberdata cursor at runtime in your custom rendering code.
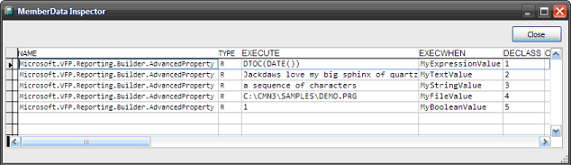 Figure 16. Browsing the memberdata in ReportBuilder.App |
Defining our own namespace in the reporting memberdata
The recommended strategy is for storing your data is in the reporting memberdata. This is available as a read-write cursor at design time (maintained by the report builder framework code) and is guaranteed to be stored safely against the report element being edited. Both the report builder and the report runtime engine handle the storage and unpacking of the memberdata cursor in and out of the FRX source file.
As we've seen earlier, any properties stored against the FRX_BLDR_NAMESPACE_ADVANCEDPROPS namespace will show up automatically in the "Advanced Properties" list in the Report Builder.
This is fine when you don't have your own UI to set the values with, but here, we will want to use our own namespace to keep the values separate.
The other advantage of using our own namespace is that how we use the columns of the memberdata cursor are completely up to us. We can even add additional columns if we want to, using ALTER TABLE.
We shall use the following memberdata columns:
| Column Name | Contents |
|---|---|
| TYPE | 'R' |
| NAME | 'Spacefold.Example.MyRender' |
| EXECWHEN | MyRender.Enabled |
| CLASS | MyRender.Alpha |
| DECLASS | MyRender.ControlSource |
Notice that we are going to expose the expression used to derive the color of the rectangle in a property called "ControlSource".
The contract between UI classes and Report Builder
Previous versions of VFP9.0 provided a mechanism that allowed you to add tabs to the Multiple-selection dialog box only. In SP2, this mechanism has been revised substantially and now you can add tabs to any default builder event handler form. All you need to do is this:
- Define a Container class that implements LoadFromFrx() and SaveToFrx() methods;
- Define a Page class that contains one or more instances of your derived Container classes;
- Register (in the builder's configuration table) the class and class library of the Page class to the appropriate event type.
It's much easier to implement this than it is to describe it. EXAMPLE4.VCX contains two classes:
- panelMyRender, a Container class that, well, contains some form controls for editing our parameters: chkEnabled, spnAlpha and txtSource;. That last one is going to allow us to edit the data-binding of the color of our custom rendering.
- tabMyRender, a Page class that contains an instance of panelMyRender, and has a Caption of "My Render".
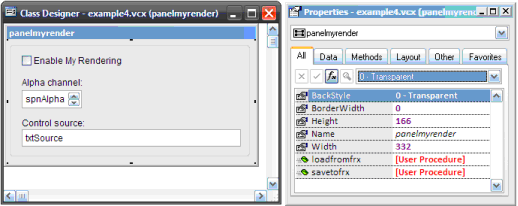 Figure 17. The panelMyRender class |
The panelMyRender container
This is actually a really simple class, implementing just the two methods required by the report builder custom UI contract:
LoadFromFrx()
This method is invoked by the Report Builder automatically, if you've defined it. It is your chance to read your parameter values from your chosen storage. Here, we're using the memberdata cursor (maintained by the report builder framework), which is available read-write at design-time, just as it is available read-only at run-time:
SELECT memberdata
LOCATE FOR type='R' AND name="Spacefold.Example.MyRender"
IF FOUND()
	THIS.chkEnabled.Value  = (execwhen='1')
	THIS.spnAlpha.Value    = INT(VAL(ALLTRIM(class)))
	THIS.txtSource.Value   = PADR(declass,75)
ELSE
	THIS.chkEnabled.Value  = .F.
	THIS.spnAlpha.Value    = 255
	THIS.txtSource.Value   = SPACE(75)
ENDIF
SaveToFrx()
The second method, SaveToFrx, is invoked by the Report Builder automatically when the builder is saving data back to the FRX source table. It is a little more complicated, given that it must save the values whether there is already a record in the memberdata cursor or not.
Unlike LoadFromFrx(), you can return .F. from this method if you wish to prevent the save operation (say, due to an invalid selection in your control panel):
SELECT memberdata
LOCATE FOR type='R' AND name="Spacefold.Example.MyRender"

IF THIS.Enabled
   IF FOUND()
      REPLACE execwhen WITH '1', ;
	        class    WITH TRANSFORM(THIS.spnAlpha.Value), ;
              declass  WITH ALLTRIM(THIS.txtSource.Value) ;
         IN memberdata
   ELSE
      INSERT INTO memberdata ;
	   ( type, name, execwhen, class, declass ) ;
      VALUES ;
         ( 'R', 'Spacefold.Example.MyRender', '1', ;
           TRANSFORM(THIS.spnAlpha.Value), ALLTRIM(THIS.txtSource.Value))
   ENDIF
ELSE
   IF FOUND()
      DELETE IN memberdata
   ENDIF
ENDIF
The tabMyRender page
This class is even simpler than the previous one, if possible. It's simply a Page class that has had an instance of panelMyRender dropped on it, and given a Caption of "My Render".
Registering the UI
Now we are ready to register the class in the Report Builder's configuration table. So it's back to the Registry Explorer. There's a shortcut to this via the command window:
DO (_REPORTBUILDER) WITH 7
This will take us straight there.
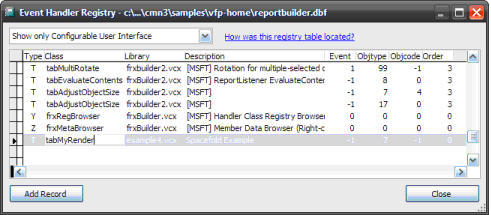 Figure 18. Registering the custom UI classes against Rectangle properties |
Change the filter drop-down to Show Only Configurable User Interface, and add the following record using the Add Record button:
| Type | Class | Library | Description | Event | ObjType | ObjCode | Order |
|---|---|---|---|---|---|---|---|
| T | tabMyRender | example4.vcx | Spacefold | -1 | 7 | -1 | 0 |
Points to note:
- The Type column indicates that this record specifies a Page class that the Report Builder framework will add dynamically to event handler dialogs.
- The Class and Library columns are self-explanatory, I hope. (See Appendix D for how the Report Builder framework searches to ensure the class is found.)
- The Event column can be used to restrict the visibility of the page to only a specific event. For example, a tab could be available only during editing, and not when a layout element was being created. A value of '-1' is a "wild card", meaning any event will be valid for this tab.
- The ObjType and ObjCode columns can be used to restrict the visibility of the tab to report layout elements of certain types. Here, we are only interested in Shapes so we use an OBJTYPE of 7.
- The Order column is used to set the value of the .PageOrder property of the tab at run time, so we can control whereabouts in the tab stack the new tab will appear. Use with caution! A value of 0 means the natural order in which the tab was added.
See Appendix C for a full list of possible configuration table column values.
Edit the Shape
Having saved our changes to the Report Builder's configuration table, now when we add a placeholder rectangle to our report layout, we should see the new tab in the Properties dialog.
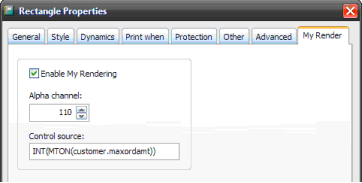 Figure 19. The MyRender tab shows up for Shapes |
We can fill the Control Source with any expression that evaluates to an integer on each row of the customer table. Here we are using the same expression as before:
INT( MTON( customer.maxordamt ))
Example 4: Our own custom namespace
Having decided to store our parameters into our own namespace in the memberdata, and implemented the UI to allow our users to set them, we need to adjust our FX object to match.
EXAMPLE4.PRG differs from EXAMPLE3.PRG in the following ways:
- The "up-front" query of the memberdata uses our custom namespace instead of the Advanced Properties one;
- It is aware of the MyRender.ControlSource property that we added to the parameters.
MODIFY COMMAND example4.prg
Revising QueryMemberdataUpfront()
Now that we're using our own, custom namespace, we need to query for different columns in the memberdata cursor. The composition of the query is now simpler and more straightforward for reading:
:
IF USED(toListener.MemberdataAlias)
	SELECT (toListener.MemberdataAlias)

	SELECT frxrecno, execwhen AS enabled, class AS alpha, declass AS source ;
	  FROM (toListener.MemberdataAlias) ;
	  INTO CURSOR (THIS.myCursor) ;
	  WHERE type     = 'R'                          AND ;
	        name     = 'Spacefold.Example.MyRender' AND ;
	        execwhen = '1'

	IF USED(THIS.MyCursor)
		IF RECCOUNT(THIS.MyCursor)=0
			USE IN (THIS.MyCursor)
		ELSE
			SELECT (THIS.MyCursor)
			INDEX ON frxrecno TAG temp
		ENDIF
	ENDIF
ENDIF
:
The index doesn't need to include the property name, because now all our parameters are stored in the one record for any given layout object.
Revising CheckForMyRender()
This method is now much simpler, a single SEEK and we can pull the parameters right out of the cursor:
:
IF USED( THIS.myCursor) AND ;
   SEEK( m.tiCurrRecno, THIS.MyCursor )

	SELECT (THIS.MyCursor)

	THIS.Enabled       = (ENABLED='1')
	THIS.Alpha         = INT(VAL(alpha))
	THIS.ControlSource = ALLTRIM(source)
ELSE
	THIS.Enabled = .F.
ENDIF
:
Revisiong Colorize()
The only change to the Colorize() method is to make the RGB color value be determined by evaluating the control source rather than the hard-coded expression:
:
local iRGB
iRGB = EVAL( THIS.ControlSource )
:
Running the example
We follow the same steps as in the previous example, switching from EXAMPLE3.PRG to EXAMPLE4.VCX:
? ox.RemoveCollectionMember("MyRender",.T.,.T.)
  .T.
? ox.AddCollectionMember("MyRender","example4.vcx","",.T.,.T.)
        1
REPORT FORM customer OBJECT ox
If all has gone according to plan, this example's output should look similar to the result shown in Example 3.
What about previewing from the Designer?
You'll notice we've been closing the report designer and running the report preview manually each time, rather than just clicking on the preview button in the designer. Why is this? It's because we've been explicitly setting up our own report listener class and linking our custom rendering code to it. But in SP2, the default reportlistener classes provided to the reporting system by ReportOutput.App are derived from FXListener. All we need to do is register our class in the GFX collections of the default report listeners.
Example 5: Taking it all the way
EXAMPLE5.VCX extends the previous example by:
- moving our MyRender FX class into the VCX as a visual class;
- using an instance of MyRender at design-time, in the panel container; and
- moving the memberdata-aware code from the panel to the FX object.
We will also add some code to enable the FX object to add itself to the default report listeners at design-time, allowing us to preview the report — with enhanced rendering — from the designer.
EXAMPLE5.VCX contains three classes:
- tabMyRender, the Page class from the previous example;
- panelMyRender, the Container class from Example 4, except that it also contains an instance of:
- MyRender, the visual Custom class definition of our GFX object.
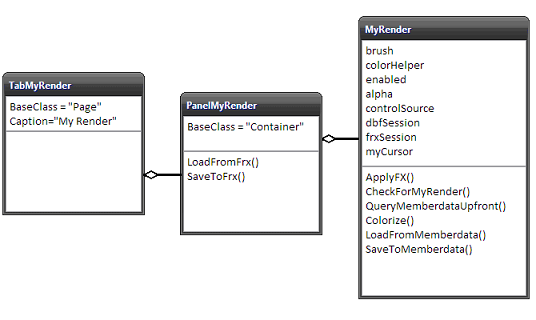 Figure 20. Classes in EXAMPLES.VCX |
Let's take a look at the visual class version of MyRender.
MODIFY CLASS MyRender OF example5.vcx METHOD LoadFromMemberData
The visual class definition of MyRender
This class implements the same methods we saw before in EXAMPLE4.PRG , but you'll notice a couple of new methods dealing with reading from and writing to the memberdata cursor.
LoadFromMemberdata()
This code is essentially the same as the methods from the panelMyRender class, only this time, instead of placing the parameter values into the visual controls, we are setting the properties of the MyRender class:
SELECT memberdata
LOCATE FOR type='R' AND name="Spacefold.Example.MyRender"
IF FOUND()
	THIS.Enabled       = (execwhen='1')
	THIS.Alpha         = INT(VAL(ALLTRIM(class)))
	THIS.ControlSource = PADR(declass,75)
ELSE
	THIS.Enabled       = .F.
	THIS.Alpha         = 255
	THIS.ControlSource = SPACE(75)
ENDIF
SaveToMemberdata()
Same for the save method:
SELECT memberdata
LOCATE FOR type='R' AND name="Spacefold.Example.MyRender"

IF THIS.Enabled
   IF FOUND()
      REPLACE execwhen WITH '1', ;
	        class    WITH TRANSFORM(THIS.Alpha), ;
              declass  WITH ALLTRIM(THIS.ControlSource) ;
         IN memberdata
   ELSE
      INSERT INTO memberdata ;
	   ( type, name, execwhen, class, declass ) ;
      VALUES ;
         ( 'R', 'Spacefold.Example.MyRender', '1', ;
           TRANSFORM(THIS.Alpha), ALLTRIM(THIS.ControlSource))
   ENDIF
ELSE
   IF FOUND()
      DELETE IN memberdata
   ENDIF
ENDIF
Enabling the custom behavior by default
At the point at which we save our parameters into the memberdata, we can also ensure that our FX object is registered with the default report listeners. First we ensure that they are set up in the IDE environment:
do (_reportoutput) with 0    && Printing
do (_reportoutput) with 1    && Previewing
Then we register our class:
_oReportOutput['0'].AddCollectionMember( THIS.Class, THIS.ClassLibrary, "",.T.,.T.)
_oReportOutput['1'].AddCollectionMember( THIS.Class, THIS.ClassLibrary, "",.T.,.T.)
Revising panelMyRender
We're not quite done. We also have to revise our panelMyRender container class to make use of the visual MyRender class instance:
Init()
Here we bind the controls to the custom class properties. We probably could have done this in the Property Sheet:
THIS.chkEnabled.ControlSource = "THIS.Parent.MyRender.enabled"
THIS.spnAlpha.ControlSource   = "THIS.Parent.MyRender.alpha"
THIS.txtSource.ControlSource  = "THIS.Parent.MyRender.controlSource"
LoadFromFrx()
Now it's much simpler to delegate to the MyRender class:
THIS.MyRender.LoadFromMemberdata()

THIS.chkEnabled.Refresh()
THIS.spnAlpha.Refresh()
THIS.txtSource.Refresh()
SaveToFrx()
Again, we're delegating:
return THIS.MyRender.SaveToMemberdata()
Re-registering the UI
We're using EXAMPLE5.VCX now, so we need to revise the report builder configuration table:
DO (_REPORTBUILDER) WITH 7
Change the filter drop-down to Show Only Configurable User Interface, and edit the value in the library column for the record of our tabMyRender registration:
| Type | Class | Library | Description | Event | ObjType | ObjCode | Order |
|---|---|---|---|---|---|---|---|
| T | tabMyRender | example5.vcx | Spacefold | -1 | 7 | -1 | 0 |
Running the example
It couldn't be simpler:
MODIFY REPORT customer.frx
We can go ahead and hit that preview button in the Report Designer now...
Putting the techniques together
Now let's go back to our underwater temperature bar chart example that we started with. We're going to add the custom GDI+ rendering so that each bar reflects the month's temperature in its BackColor in addition to its apparent height.
Expressing a dynamic BackColor
If you recall the expression we developed for the height of the white-space shape:
960 - int(960/20 * (temperature-10))
We need to derive an RGB color value from the temperature data. If we choose our R,G,B component byte values carefully, we can use the RGB(..) function to return a color value that varies from blue to magenta as we sweep the value of the red component through the possible values of 0-255.
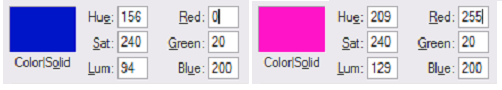 Figure 21. Selecting the R,G,B byte values for "cool" and "warm" |
The dynamic expression we need to return a value that varies from blue to magenta as the values change within the data's temperature range is:
RGB( INT( 254 * (temperature-10)/20), 20, 200 )
Now, with our environment all set up correctly, it's simply a matter of editing the shapes in the UNDERWATER.FRX report layout and enabling the MyRender facility:
MODIFY REPORT underwater.frx
What could be simpler?
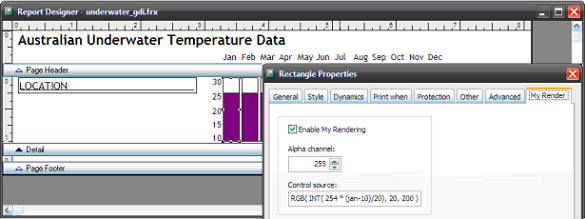 Figure 22. Entering the expression |
Running the report underwater
The final effect is probably not practical but demonstrates the principles.
REPORT FORM underwater_gdi.frx PREVIEW
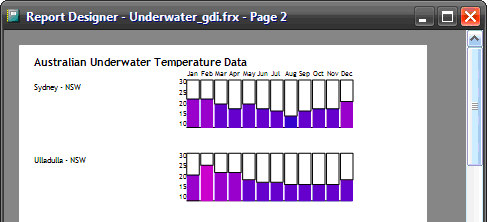 Figure 23. Dynamic size and color make a pretty bar chart |
And Finally
This wasn't supposed to be a tutorial on GDI+ programming, or a lecture on advanced data visualization. Hopefully you have seen that in VFP 9.0 SP2 that we have a number of creative techniques to use in displaying data in reports.