
By Lisa Slater Nicholls
November 1998
If you don't already read Bob Lewis, stop reading this right now and get yourself to www.issurvivor.com, where you will truly find words to live by.
The (extensive) source for this article is available in Spacefold downloads as CovTestingSource.zip. I dug it out for this Spacefold publication event, so there is no guarantees that it exactly matches the text of the article, which may have been taken from a different version of the session notes. It has some interesting examples of leveraging the shipping COVERAGE.APP interfaces. You'll find more information on this subject in an old article titled Visual FoxPro Coverage Profiler Add-Ins and Subclasses, if you're interested.
You'll notice that one of the add-ins in that old piece gives you a way to display stack-level information, which is discussed briefly in this piece as not having any default representation in COVERAGE.APP. As you may know, we later updated COVERAGE.APP to have a simple representation of stack level information using XML and XSLT. You'll find more information on that COVERAGE.APP change, as an illustration of XML capabilities and applicability in VFP, in another piece I wrote to discuss the relationship of VFP and XML a long time ago.
Of course, even though VFP7's COVERAGE.APP provides only a simple stack representation, it's XML + XSLT, so you don't have to live with it in the delivered format — please keep that in mind. Naturally, when we added this feature to COVERAGE.APP we also added a configuration option so you could change the XSLT. Go to town, write some XAML!
As another version note, there is a section discussing using the shipping COVERAGE.APP with VFP 5; keep in mind that the app originally shipped with VFP 6.
It's all interesting, and it's all interconnected. But the source, and all these ways you can leverage COVERAGE.APP, no matter how extensive, isn't the point.
After you've grokked Bob and Bob's wisdom on www.issurvivor.com and have returned to read this article, you will find some advice that's really timeless. That's why I'm re-publishing it now. Understanding coverage and code profiling, creating good test practices, policies, teams, and plans, are requirements that never go away.
It's also not coding-environment specific. If someone has recommended this article to you and you are not a VFP programmer, don't leave too quickly. Read the intro and then skip down to the testing section that follows the VFP-specific implementation details.
What we'll cover
This session is about testing apps thoroughly. That's a tall order, because testing means more than just "running tests". Tests have to be designed, before they're run, and interpreted afterwards.
A large portion of the session is devoted to showing you how to get maximum value from Coverage analysis in Visual FoxPro. You will learn to tune, extend, and subclass the shipping Coverage Profiler classes. You'll also learn about the concepts of Coverage and Profiling as they apply to, and are implemented in, VFP.
The SET COVERAGE TO <filename>
command, which was new in VFP 5, automatically generates a log
during code execution. This data can help you pinpoint areas
of your code that may not have been tested sufficiently, are
under-utilized, or are responsible for unacceptable delays.
COVERAGE.APP, shipping with VFP 6, analyzes the log for you
and allows you to explore these possibilities.
Coverage is a new and exciting feature in VFP, but it's only part of the picture. To make your apps robust, you should be familiar with some other testing concepts and tools, beyond coverage and profiling, so the session introduces these additional topics for you to evaluate and investigate.
Bug-flushing is respectable work
When you look for defects in code, it's often difficult to keep your mind on this goal, as separate work from code development. As developers, we're all problem solvers, and we like to fix things. It eases our personal pain. This is one reason why having testers who do not develop, if your organization is large enough, is so helpful (a subject to which I'll return later).
Testing is not debugging
Although it satisfies our personal urges, attempting to explain or debug crashes as you go is not as productive as logging bugs without attempting explanation and fixes. Fixing one bug in isolation can actually contribute to a wrong conclusion about its cause, and eventually to more complex bugs that multiply like roaches. One bug in isolation may be mystifying, while it looks obvious (and easy to fix) once it's seen in the context of a bug log containing many other issues, a statistical analysis of coverage, and other components that make up a "full body of evidence".
Even if you do all your own testing, do your best to collect this evidence before you jump to make bug fixes. You'll find each bug take less time to fix this way.
Testing is not (for once!) about performance
I mentioned that the coverage log generated by VFP helps you find "unacceptable delays" in your code. As VFP developers, we are so used to thinking about testing our code to tweak it for minute advantages of speed, that sometimes we think this is the whole point of testing.
Although you can use the log to help you tweak performance, that isn't the kind of delay you should be thinking about here. VFP executes most lines of code extremely quickly — so quickly that the limited resolution of the log gives out. Most lines will show up as taking 0.000 seconds in the log!
You can use a slow machine to bring up the timings until you can see some relative times of execution (you'll find some tips to make this easier, later in this paper). If you do, however, be aware that the very act of writing the log demonstrably affects these results, and may invalidate any conclusions you draw from the log.
Instead, the "unacceptable delays" I want you to think about
are gross timing differentials. Did a SQL SELECT take four times
as long against one lookup table than another? Perhaps a DELETED()
tag is missing or somebody overrode the .Load method of a form
class and the DELETED OFF setting is lost. Did a .Refresh()
method code take a suspicious length of time? Perhaps it triggers
a lot more code than you think it does. Is a loop running twice,
or more times, is its exit value wrongly initialized or its
record set inappropriately defined?
These examples aren't just Performance Tweaking Opportunities; they indicate bugs. In each case there is potential for wrong results, not just a few extra seconds of waiting. Suspicious delays in your code are red flags. They identify bad code, not just slow code, and problems waiting to happen.
I know you are going to test for performance anyway. You're not going to stop being VFP developers just because I scold you; we have a reputation for the fastest data handling on the planet to protect, after all!
Just keep reminding yourself that apps have to run without crashing, to be described as truly fast.
With these points in mind, let's take a look at techniques of Coverage and Profiling in VFP, so you can use them to help bug-flush.
Coverage and Profiling in VFP
In VFP, you generate a coverage log simply by SETting COVERAGE TO <a logname>before running your code. With the results, you can do coverage analysis and profiling. In VFP 6, the COVERAGE.APP helps you perform these tasks.
As I talk about VFP Coverage below, I will refer to the "Coverage Profiler" or to COVERAGE.APP separately from something else called the "Coverage engine". The "Coverage engine" is a VFP class with extensive methods that work on the internally-produced coverage log and organize its contents in a series of tables, which I'll call its "workfiles". The Coverage Profiler, or shipping COVERAGE.APP, simply instantiates a subclass of this engine with a default display of the engine's results.
You can examine all the source code for the shipping Coverage Profiler and its underlying engine, because they're all delivered with the product. You'll need to unpack these source files, first; you'll find them in an archive named XSOURCE.ZIP under the HOME()+ "TOOLS\XSOURCE" folder. You may want to unpack the source now, to refer to various items I'll mention throughout this paper.
Some additional housekeeping notes before we get started
Throughout this paper, I'll demonstrate points with various subclasses and AddIns. A "subclass", obviously, may be a subclass either of the engine or the standard shipping interface class. In addition, be aware that "AddIns" are a feature of the engine, not the standard interface subclass, so you can have AddIns for any engine subclass you create. (Some AddIns will be designed to work only in a specific engine subclass, and should error trap accordingly when they start up.)
The paper also refers you to various source files and TXT files with additional information. All the TXT files are part of the source code for this session, and you'll find them in the same directories as the relevant source code. A general README.TXT in the root source folder gives you any necessary instructions on setting up the source.
The AddIns you see used here are in your \ADD folder. If you run ADD_INS.SCX, shown in the next figure, you'll have access to all the other sample AddIns and the text files that describe each individual AddIn. Each AddIn has an associated TXT file of the same name. The ADD_INS.TXT, in the same folder, is also available within ADD_INS.SCX It gives you a great deal of general information about using and creating Coverage AddIns.
The subclasses described in this paper are in the \SUBCLASS folder in your source code for this session. You'll need to unpack the source code before using the sample subclasses, and you'll need to Locate their parent classes in the COVERAGE.VCX that is part of the shipping Coverage source code in XSOURCE.ZIP.
With all this out of the way, we can return to examine Coverage in VFP...
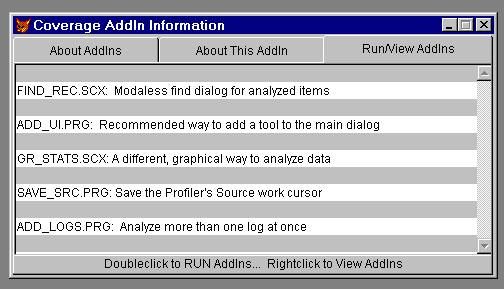 Figure 1. A "meta-AddIn", ADD_INS.SCX provides text, source editing, and execution for all the other AddIns delivered with this paper. |
|---|
Coverage analysis
Coverage analysis is about figuring out what code ran and what code didn't run. If you haven't run a block of code, you haven't tested it. If you haven't run a code construct, after repeated attempts, you may need to re-evaluate your tests. If you have validated your tests and you still haven't covered a code construct — or even a single line of code — after repeated attempts to test it, you need to re-evaluate that code.
Uncovered code may represent "dead weight" you can remove. This is not only an opportunity to streamline your memory footprint and the size of your app; it is an opportunity to prevent future confusion about what your code actually does, when somebody tries to maintain or extend it months later.
On the other hand, uncovered code may represent some other blockage, a bug that is preventing this code from running when it should run. This is a more dangerous, and also a likely, possibility.
Don't be too quick to prune code that you didn't cover, until you're sure. But pay attention; uncovered code is a significant symptom.
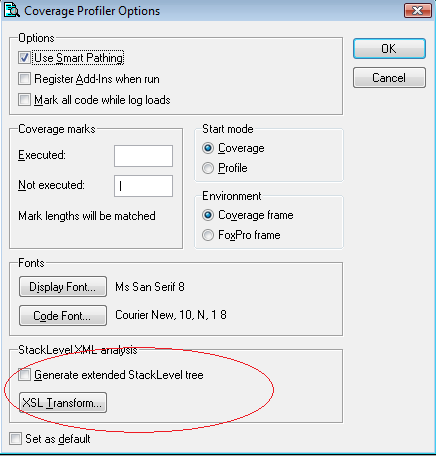
In most situations, you are interested to see what code didn't run. This is why the Coverage Profiler defaults to putting a mark against uncovered lines of code; you can easily scan for uncovered lines. You can choose to mark covered lines instead, or put a different mark against each type (see figure 2). You may choose to mark only covered lines when you know you have done very limited testing and have a specific area of concern in mind.
You may even choose to mark both, to clearly delineate "coverable" from "uncoverable" lines of code. I'll explain what kinds of lines are "uncoverable" later in this paper.
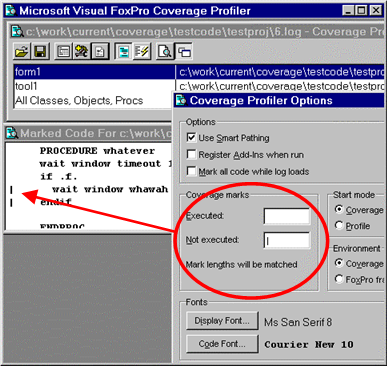 Figure 2.The Coverage Profiler defaults to marking uncovered lines, but you can change this default in its Options dialog. |
|---|
Looking for 100% Coverage
If you've executed every line of code, you can proudly announce that you have reached 100% coverage. Once you have properly disposed of "uncoverable" lines of code, this is an achievable goal, and in fact you should attempt to achieve it in most cases.
In VFP's hybrid OOP-and-procedural language and multiple-source-code-type packaging projects, there are actually several different sorts of 100% coverage you can achieve:
- 100% coverage of all the lines in accessed procedures and methods of objects that instantiated
- 100% coverage of objects
in class libraries. Especially if you use class libraries from
multiple sources in a large application, it is important to
consider object coverage before you get too fussed about your
line coverage statistics. If you got 100% line coverage but
only "touched" half the object, then you have 0% coverage on
the objects never hit. Is this okay? Do you need to re-package
libraries to manage dead weight, or do you need to make sure
you test those other objects?
GR_STATS.SCX is an AddIn showing a graphical interface to allow you to concentrate on object versus line coverage for the object-containing source code files represented in your log. This AddIn also provides one of the multiple log interfaces in ADD_LOGS.PRG, and is instanced on its own as an example subclass of the Coverage engine, in COV_ENG2.PRG, as shown in the figure below. - 100% coverage of files in a particular project. If you're trying to make sure you've tested an application, you may have 100% coverage of the lines in the files you hit — but did you execute all the files with code?
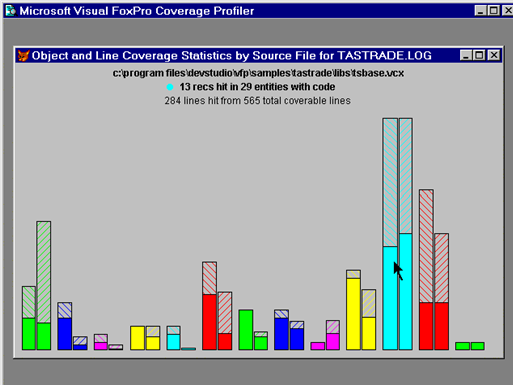 Figure 3.GR_STATS (shown here instanced as a subclass of the Coverage engine in COV_ENG2.PRG) is an "alternative" Coverage analysis interface, concentrating on a comparison of object-versus-linecount coverage on a file-by-file basis. |
|---|
The Coverage Profiler takes the information from the internally-produced coverage log and gives you information on the different types of coverage you can achieve (see figure 4). As with any type of statistics, it's up to you to weigh the results and decide what they mean to you.
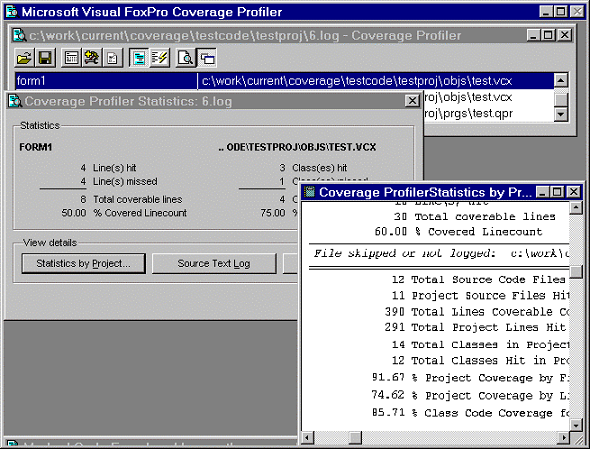 Figure 4.Coverage statistics by lines, objects, and files in a project are all important to VFP — and the Coverage Profiler investigates them all. |
|---|
Thinking about dependency coverage
If you've tested every pathway or avenue from which a line of code or method can be accessed, you can say you have 100% dependency coverage.
In VFP 5, the coverage log didn't give you much information that could help you determine dependency coverage. If you were careful to track the changes in method or procedure names from line to line in the log, you could track dependency, but this would be quite tedious. In VFP 6, an extra column was added showing you the callstack level, which makes it much easier to see the paths through which you've reached any line of code.
100% dependency coverage is a nice idea, but quite possibly not achievable, and the Coverage Profiler doesn't touch it by default. The Coverage engine behind the Profiler gives you access to a vast amount of information (including, of course, this new column). It doesn't display all that information, but it makes it easy for you to decide how and what you want to display.
Why doesn't the Coverage Profiler application use or display this information? There are several reasons:
- A callstack or dependency display would look quite different from the user interface you use in the Coverage Profiler application. Presumably it would have some sort of tree or outline structure, so you could watch the levels change. Should it show you objects, and how they depend on and call each other? Should it, by contrast, show you method-by-method dependency? And how should non-object-oriented code fit into this display? Your call! (In a forthcoming white paper, I'll present a simple call stack display, but it's completely separate from the current standard Coverage Profiler User interface, although you can add it into that interface as an additional form.)
- I've said that the goal of 100% dependency coverage is not
a realistic goal. Here's why: you can look at the dependency
that has occurred when you tested, but this does not tell you
what percentage dependency coverage you achieved, because no
figure for the "total number of possible paths" is accessible
to it.
What is this number? Should the number include counts for objects not instantiated in VCXs or project files not executed? Should the tool look through all code for KEYBOARD statements and macros before it is satisfied with "total number of paths" for a Keypress method? What about MOUSE statements for a Click method? What about macro-expanded expressions that may include a call to a method or procedure? Don't forget about ON... statements that may execute this call when you look for potential paths; I'll return to this issue in the section on "Uncoverable and unattributable code" below.
The Coverage Profiler's standard display is biased in favor of statistics it can give you, and this is obviously not one of them — until you figure out what "total number of paths" means. - � A tree or outline view of anything that occurs in large numbers is "expensive", in terms of system resources. Remember how quickly VFP processes code, and how many events are occurring, in just a few minutes of your application's "life span". You'll soon discover that huge coverage logs are produced in a few minutes of testing, especially if your code iterates through loops. The Coverage Profiler is optimized for these huge logs — and, below, you'll find ways you can tune it still further in this respect. If you wish to look at dependency, your personal display of this information will probably take some steps to limit the size of the logs or the contents you display.
In spite of all these cautions, don't throw the concept of dependency coverage away. Making sure that your code is not just covered but covered through different pathways is quite important.
Just recognize that this aspect of testing is not subject to the same rigorous metrics as you may apply to other aspects. Testing is as much an art as it is a science.
Code Profiling
Profiling is about how much time your code took to run. The log shows statistics against individual lines of code, but profiling is not really how much time your code takes line-by-line. Think of each profiling number as showing how much time it took to perform a particular action, or in some cases how long the program remained in a particular state.
If a line of code evaluates or assigns an expression, then the time the line took is how long that evaluation or assignment took. However, if a line of code calls another procedure or method, then the time that other procedure or method took is included in the time required by this action.
For example, consider the following short program:
       do mytest
       proc mytest
          inkey(5)
       endproc
When you examine the Profiling statistics for this program,
you find that line 1 in the main program took as much time as
line 1 in the mytest procedure to execute; in this case, perhaps
around 5.010 seconds. You know that the line do mytest did not
take as much time to execute as inkey(5). However, the action
of executing the line do mytest took this long.
Similarly, a main program or object method containing the command
READ EVENTS shows a long span of time for that particular line.
In this case, you might say that the number represents the amount
of time the application was in the READ
EVENTS wait state. That
includes all the time the user was performing useful activities
within the READ EVENTS state, by the way, not just the periods
of inactivity.
As explained earlier, at least at the granularity that you can
get in VFP, you want to concentrate on identifying important
problems here, not on tweaking performance. As you can see,
you also have to identify which kinds of lengthy times are really
indicative of problems and which are not. In the example I just
gave you, the lengthy times a READ EVENTS line is not a problem,
but if a particular method took an inordinately long time, perhaps
you need to check it out.
Cov_LimitDuration is a subclass of the standard Coverage Profiler interface class you'll find in COV_SUBS.VCX, in the \SUBCLASS folder (see COV_SUBS.TXT). If you're interested in identifying problems through Profiling, you can use this class to limit the items analyzed and displayed. It brings up a dialog that adjusts the records in the source workfile before creating target records to your specifications.
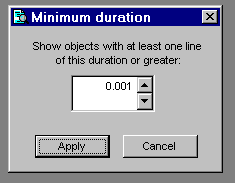 Figure 5.Cov_LimitDuration's dialog allows you to target source files and objects containing lengthy procedures and methods only. |
|---|
George Sexton (mailto:gsexton@mhsoftware.com) has written a log-analyzing application you'll enjoy, especially if you are more interested in profiling than coverage. George concentrates on performance and timing statistics, and his interface gives you well-targeted opportunities to cull or sample information from large logs. George plans to make his application available to the VFP community; check with him for its current location.
Cov_omitter, discussed below, is a subclass of the Coverage Profiler that shows you what techniques I recommend for handling this type of sampling within the shipping interface.
Whether you use the shipping COVERAGE.APP, George's application, or any other analysis tool, you will get a better sense of Profiling times (somewhat finer resolution) if you use a very slow machine to generate the Coverage log. However, you'll then want to move your log and your code to a fast machine to analyze the results.
If you do this, you'll find it convenient to keep the same path information for the source code as you used on the original machine. This way, the Coverage Profiler will be able to identify the source code components without asking you to locate these files. You can also analyze source files and logs that remain on the slow computer, from across a network on the fast computer. You'll still have to identify some path information for the Profiler if you do this, because the file locations won't look the same from across the network as they did on the original machine.
You have another choice: you can remove pathing information from the log. This is described in the section on tuning below, and requires that you understand how the Coverage Profiler understands paths and file locations.
Manipulating, Enhancing, and Tuning the Coverage Profiler
Cov_LimitDuration is an example of tuning the Coverage Profiler to give you exactly what you want. As you'll soon find out, many types of tuning you'll want to do will involve setting some limits or sampling items from the log. This will help reduce the diskspace, time, and memory required to do Coverage analysis and — if done properly will still give you productive results. This section explores some of the many ways you can adjust the Profiler.
There are a number of techniques you can use to tune the Coverage
Profiler and its underlying engine to your particular needs.
First, you can call the app directly with its parameters, rather
than calling it from the VFP menu. Try calling it with this
command: DO (_COVERAGE) WITH .T. (use any non-empty, non-character-type
parameter), and you'll get a messagebox showing you the parameters
you can legitimately use.
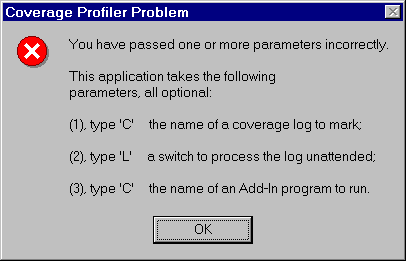 Figure 6.This messagebox will set you straight if you call COVERAGE.APP or the coverage main class with incorrect parameters. |
|---|
These parameters are passed directly to the instantiated Coverage class from the wrapper program.
The first parameter will pass a log filename, so you don't need to pick it on startup.
Alternatively, if you analyze logs directly after creating them,
don't bother to SET COVERAGE TO <nothing>
before you start the Profiler. The Coverage object will automatically
turn coverage off and analyze this log without bothering to
ask which log you wanted. Later, when you release the Coverage
object, it will ask you if, and how, you would like to re-open
this log.
The second parameter is for "unattended" Coverage runs. If you pass .T. here, no interface will appear. The engine will automatically mark all the source code it can locate without your help, in both Profiling and Coverage styles, and save the resulting target workfile to disk. (Later in this paper I'll describe the various workfiles in more detail; for now, just remember that the "target workfile" holds the Coverage analysis results.) If you've used COVERAGE.APP and opted for an unattended run by passing this parameter, the wrapper program for the Coverage object will show you the resulting tables in BROWSEs. (In fact, this is the only service the wrapper program performs.)
The third parameter runs an AddIn in the Coverage class Init, just after the initial workfile set is created. You can use this parameter to add some user interface element to the Coverage Profiler before it appears.
For an example of this type of AddIn, try the following command from your \ADD folder:
do c:\work\current\coverage\current\coverage with <log name>,,"add_ui"
Tuning with AddIns
The AddIn-in-question, ADD_UI.PRG, puts a button in the Coverage standard interface main dialog's Tools container, using the standard subclass's AddTool() method to do so. This is a particularly good method to add a user interface element to the standard Coverage Profiler interface — because it will alert the main dialog to the new element and allow the main dialog to adjust its minimum height and size accordingly — but you can use any method you prefer.
The AddIn-in-question, ADD_UI.PRG, puts a button in the Coverage standard interface main dialog's Tools container, using the standard subclass's AddTool() method to do so. This is a particularly good method to add a user interface element to the standard Coverage Profiler interface — because it will alert the main dialog to the new element and allow the main dialog to adjust its minimum height and size accordingly — but you can use any method you prefer.
The button placed in the dialog by this AddIn invokes a "Find" dialog (also available as a separate AddIn, FIND_REC.SCX). You can see both the button and the Find dialog in figure 7 below.
Like Cov_Duration, FIND_REC illustrates an important way you can enhance or tune the Coverage Profiler: your Coverage logs often include a huge number of source records, and even a huge number of target objects and source code files. It's important to find a way to spelunk around in all this material, to find what you are looking for, as FIND_REC is designed to do.
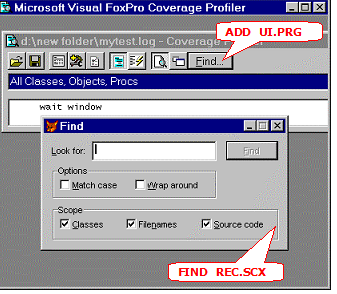 Figure 7.AddIns ADD_UI.PRG and FIND_REC.SCX at work enhancing the standard Coverage Profiler interface features. |
|---|
File locating
Another tuning opportunity you have in Profiler use involves its method of locating files. By default, the Coverage Profiler has an option called "Smart Pathing" turned on. This causes the Coverage Profiler to work very much like the Project Manager when it comes to finding files; once you Locate a file in a particular directory during a log's load process, the Profiler will know to return to that directory for additional files without asking you again.
You should almost never need to turn off this option, unless you know your log contains information about multiple filenames with exactly the same name (including extension), and no usable path information. This may happen if your log contains information from multiple projects and you've moved the source since generating the log, or if you use non-standard extensions for your text-type source code. For example, MYPROG.PR1 and MYPROG.PR2 will both compile to MYPROG.FXP.
However, even with Smart Pathing turned on, you may want to limit the number of directories you are asked to Locate. The best way to do this, if you use some standard project subdirectory structure for your source code, is to make sure your default directory is the same as your main project's, before you load a log. You will have much better results if you start out from this folder, rather than the log's folder or the COVERAGE.APP's own folder, and the Profiler will ask you fewer Locating questions.
Remember that the Coverage Profiler is a modaless application. If you analyze multiple logs in one session, simply CD to the appropriate folder in the Command Window before you load each log.
As mentioned above, there are times when you will want to remove pathing information from a large Coverage log, because you're analyzing the log on a different machine than created the log. Here's a quick way to remove path information, even from very large logs:
MODIFY COMMANDthe log file (open it for editing in VFP).- 2. Use the VFP Find and Replace dialog to change the leading
comma from the appropriate log column all the path information
to the project directory with a comma, so that (for example)
,c:\program files\samples\tastrade\libs\tsgen.vct becomes ,libs\tsgen.vctin the new version. Because the backslash is the control character in this dialog, you will have to type,c:\\program files\\samples\\tastrade\\in the Find textbox to achieve this result. - Now, if you CD to the project directory, and if the relative pathing in the PJX is normal, you should have few files to Locate.
Make sure to analyze the correct files
There is one type of file for which the Coverage Profiler must always verify location: the main file of an APP or EXE. Because of the way the generated log presents its information, there is no way for the Profiler to know for certain which PRG is really the correct main program, even though it has the name of this file. It takes a reasonable guess but always requires you to verify that guess.
As you can see, there are opportunities for erroneous statistics here! Suppose you identify the wrong MAIN.PRG to the Profiler, or even just a different version of the same MAIN.PRG? If the source code is even one line different from the compiled version, your results are invalid. The Coverage Profiler will merrily assign profiling times or coverage marks against lines based on their line numbers within a file. All it knows is the line number, it has no way to validate the contents of that particular line.
If you add even one comment, recompile before you generate another Coverage log. This caution applies to all source code, not just PRGs.
Diskspace and workfile tuning
Along with tuning the interface and log-loading procedures, you will probably want to tune the amount of diskspace the Coverage workfiles use. One good way to do this is to limit the files analyzed to the Coverage log records that truly interest you. Cov_Omitter is a subclass of the standard Coverage Profiler interface that shows you the most efficient way to perform this task. After the engine has validated a source file that you've chosen, indicating that this file is proper log format, this subclass brings up a dialog. In this dialog you choose either the files you wish to include in the analysis or the types of files you would like to omit from the analysis.
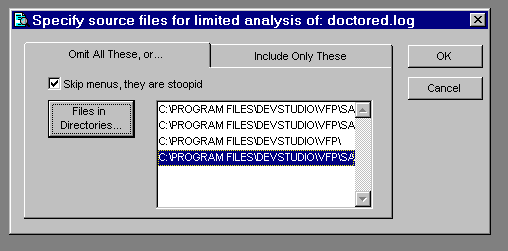 Figure 8. Cov_Omitter subclass lets you choose files to exclude... |
|---|
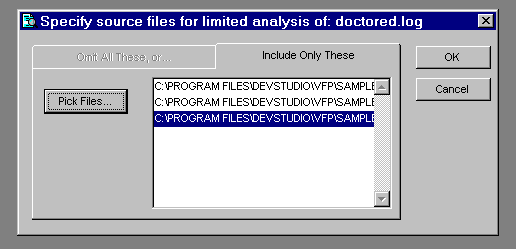 Figure 9. ... or include files for analysis. |
|---|
This dialog and the choices it presents are only an illustrative sample. I do think, as figure 8 above shows, that MPXs should be ignored in Coverage analysis a great deal of the time, especially if you don't write Cleanup procedures, as most people don't. The menu definition code is executed once, and is very predictable and clean as generated from GENMENU. The triggering of this code in response to ON SELECTION statements, as I've indicated in another section, cannot be properly accounted for in Coverage analysis.
However you decide to set your criteria, the way this dialog achieves its results — using low level file functions to create a stripped-down version of the log, before the engine goes to work producing any workfiles from the log — is the way I recommend you do this kind of tuning. It will take time for the low level file functions to go through the log items and evaluate them according to whatever criteria you set, but this will be less time than it would have taken to process the original log. More important, the size of the workfiles created will be significantly reduced.
Once again, remember that a few minutes' testing can create a Coverage log of many megabytes. This log sometimes translates into hundreds of megabytes of temporary workfiles.
Limiting the diskspace the engine uses while creating its workfiles is arguably the most important tuning you can do. However, it's a complicated proposition.
Except when you run in Unattended mode, the Coverage engine creates no persistent files unless you ask it to explicitly, using the engine's SaveTargetToDisk() method, or some other means. (In Unattended mode the engine saves the target to disk automatically, so you can look at the results whenever you're ready.) The Coverage workfiles are all cursors.
The AddIn SAVE_SRC.PRG, shows you how to save the FromLog cursor to disk. The standard interface allows you to save the MarkedCode coverage results, but omits this option, primarily because the FromLog cursor is so big and contains pretty much the same information as the original text log. SAVE_SRC is of interest primarily because it gives you some simple examples of the engine methods at work on a Coverage cursor.
What is the significance of the fact that the Coverage engine
works entirely with cursors? Simply that they're under VFP's
direct control. You can direct where the cursors are created
and where the bulk of the diskspace is used, with the CONFIG.FPW
SORTWORK entry (one of the three TMPFILES items). Coverage's
work is also impacted by the location of EDITWORK, because it
massages large memofields.
Although one would want to avoid running out of diskspace in
the middle of an operation like Coverage analysis, because these
cursors are under VFP's direct control, there is no absolute
way to predict where the diskspace failure will occur. An operation
may fail in the middle during the APPEND FROM of the source
log into the source workfile, the indexing of the source workfile,
or the import of source code into the target workfile.
The amount of memory and space each cursor takes up is not stable, and the moment at which Fox deigns to write these things to disk cannot be predicted with certainty, even on multiple runs against the same log on the same machine. Even when a cursor is completely prepared, with sufficient memory VFP may still hold that entire file in memory rather than writing to disk at all. The moment at which the file is written to disk may come while you're looking at individual records, and the engine is placing marks against individual source code items. As you move to a new item in the list box, you may suddenly notice a tremendous amount of disk activity as the entire cursor is suddenly written to disk!
If you're concerned about how much disk space you have available to you, you should not use the Coverage "mark all records on load" option. For large logs, you may also want to use "Fast Zoom Mode" (right click while in zoom mode to achieve this), so you can choose to mark only those records that interest you.
Fast Zoom helps you with target items that have a large number of lines (like an MPR) that don't interest you at all, because you can scroll through those items without marking them. However, these items still add a great number of lines to the source cursor, and consequently to the length of time it takes to mark other target items and gather statistics, as well as the overall size of the source cursor and its indexes. This is why an earlier limiting device, such as the cov_omitter subclass, is a superior idea, if you know what you are looking for in the log.
You have still more ways to tune diskspace use. The Coverage engine has three properties that determine several of the field sizes in both the source and target workfiles:
                    THISFORMSET.iLenHostFile
                    THISFORMSET.iLenObjClass
                    THISFORMSET.iLenExecuting
These properties receive their default values from three #DEFINEs in COV_TUNE.H:
                    #DEFINE COV_LEN_HOSTFILE 115
                    #DEFINE COV_LEN_OBJCLASS 115
                    #DEFINE COV_LEN_EXECUTING 115
These items are set at what might be considered their maximum (115 each) because any two may be used in a concatenated key.
To conserve disk space, especially in the source cursor and its CDX, you may reduce the size of these fields if you wish. However, use care, or errors will occur when filenames or object/container information is truncated.
COV_TUNE.H, discussed below in the section on Coverage header files, contains copious notes and advice on tuning these values. Be sure to read the comments in this file, and then go ahead and try different values for these properties according to the rules set out in COV_TUNE.H. You need to be careful because, in many cases, truncation of cursor workfile information will not result in crashes. Instead, you'll receive incorrect statistics that look just as "real" as the right ones.
VFP project coverage
VFP coverage analysis is not, by nature, a project-centric activity. A single log may include information from multiple apps and multiple projects. However, sometimes you are interested primarily in the analysis of one project and its source files. For this reason, the Coverage Profiler Statistics dialog gives you an opportunity to pick a project to analyze. The engine evaluates all the files listed in that project with appropriate source code types and lets you know which files you've covered, and to what degree you've covered them.
To do this job properly, you will notice that the Profiler quickly goes through all the target workfile records to make sure they have already been marked and that all relevant statistics are available, before going on to report on Project coverage.
Yes, I said "report", and I meant "report"<g>. The default Profiler display of project statistics uses an FRX. This report form is quite rudimentary, and it's designed for you to edit to your liking. You can either edit COV_PJX.FRX directly or change the COV_TUNE.H #DEFINE that indicates the appropriate FRX, and design a completely new report.
Project statistics are gathered in a separate workfile from other Coverage results, in this format:
                       CREATE CURSOR (cProject) ;
                             (Hostfile c(COV_LEN_HOSTFILE), ;
                             FileType c(4), ;
                             Coverable n(8), ;
                             Covered n(8), ;
                             ObjTotal n(8), ;
                             ObjHits n(8))
You'll find this line in the engine's GetProjectStatistics() method. Here is the sequence of events that takes place in the engine's ShowProjectStatistics() method:
- GetProjectStatistics() is called to gather the statistics.
- If the above is successful, DisplayProjectStatistics() is called to show the statistics to the user.
In the engine class, DisplayProjectStatistics() is abstract
(empty). In the standard User Interface engine subclass, DisplayProjectStatistics()
issues the REPORT FORM statement with appropriate WINDOW clauses
and other behavior for this report to appear within the standard
Coverage Profiler interface.
This is a perfect example of the relationship between the Coverage engine's role and the responsibilities of the display or interface subclasses. It also gives you an idea of your opportunities to create behavior that you might prefer. As you can see, along with simply modifying the report form, your Coverage subclass might:
- add columns and calculations to the Project workfile, or perhaps eliminate some files that are not of interest, by augmenting GetProjectStatistics()
- change the display to another report, a BROWSE, save the Project results to disk instead of displaying them, or do anything else you like, by creating an entirely different DisplayProjectStatistics() method.
Coverage in VFP 5
Can you do all this good stuff in VFP 5? The short answer is "yes"!
The standard COVERAGE.APP will run in VFP 5. Although I haven't tested extensively, I would expect most or all of the sample subclasses of both the engine and the shipping interface class, plus all the AddIns, to work in VFP 5 as well as VFP 6. (In fact, GR_STATS.SCX originally used an ActiveX control, but I re-wrote its graphical interface in pure VFP code, simply to avoid versioning problems<g>.)
To use the Coverage Profiler in VFP 5, you will need to follow these steps, first:
- Unpack the Coverage source into the location of your choice for its VFP 5 version. In that location, and under VFP 5:
COMPILE REPORT COV_PJX. This step is necessary because the default project-reporting FRX contains code and an APP re-build in VFP 5 won't recompile this code.BUILD APP COVERAGE FROM COVERAGE RECOMPILE. That's it!
COVERAGE.APP will now run in VFP 5. The VFP 5 log has a few
limitations. Accordingly, the app will not show you information
about FRX or LBX files in VFP 5, because code for reporting
objects is mis-attributed in the VFP 5 log. You may find that
a few other statistics are mis-represented. (Primarily, VFP
5 logs did not handle DODEFAULT() items very well, and will
mis-attribute the execution of parentclass lines invoked by
a DODEFAULT() to the child class that contained the DODEFAULT()
statement. You may also notice some problems with leaf objects
— option buttons, pages, command buttons in command groups
— for which you've written code.)
However, in my experience, the inaccuracies and omissions will be minor. They do not detract from the general usefulness of the analyzing tool (or even the generated log) within VFP 5.
Although VFP 6 can run VFP 5-compiled code, you should probably BUILD ... RECOMPILE separate versions of the Coverage app for VFP 5 and VFP 6 on general principles.
Also, you will only be able to analyze VFP 5-generated logs in VFP 5 and VF 6-generated logs in VFP 6. This distinction is made at runtime, not compiled time, and is intended to make sure that you know exactly what you are testing. (If you executed the code and generated the log under VFP 6, in other words, you should analyze its coverage under VFP 6 — whether that code was compiled in VFP 5 or VFP 6 is irrelevant.)
One problem people might have with the Coverage classes under VFP 5 involves the use of the common file dialog ActiveX control for file- and font- picking. You may have different versions of this control in your system.
In most cases, whether under VFP 5 or any other product version, the Coverage classes will detect any OCX error and switch smoothly over to use of GETFILE(), PUTFILE(), and GETFONT() after the first such error. However, you can permanently dispose of the problem (or you can take care of it in any case where the OCX error is not trapped and the switch isn't automatic), by changing a #DEFINE in the COV_TUNE.H file, discussed below.
VFP Coverage and Coverage Profiler Internals
But wait — there's more. This section will tell you quite a bit more about how the Coverage Profiler works, and also about how Coverage works within VFP. Skip this entire section, if you've had enough of these details for now, or read on to see more ways you can manipulate the Coverage Profiler features and more deeply understand the internally-produced Coverage log.
If you do skip the rest of this section, I recommend you come back and read the material on the Coverage workfiles at a later date. Understanding these cursors, and especially understanding the engine's ability to manage multiple sets of these cursors, is critical to getting maximum value from the Coverage engine.
Understand and use the COVERAGE.VCX source
The COV*.H files and the COVERAGE.VCX/VCT contain all the source you need. The wrapper program that instantiates the shipping class in COVERAGE.APP is not necessary.
You can instantiate cov_Engine (the engine class), cov_Standard (the shipping UI subclass), or additional subclasses, from the Command window, with a simple call:
                   * SET PATH TO the location of COVERAGE.VCX
                   NEWOBJECT("cov_standard","coverage.vcx")
Notice I said that you should SET PATH to COVERAGE.VCX's location.
This is because the coverage classes will need to instantiate
other items from this VCX later on.
If you build the above NEWOBJECT( ) line into an .APP of your
own, the SET PATH will not be necessary. Not only will COVERAGE.VCX
be pulled into the project, and therefore be available to the
APP, but EXTERNAL statements within COVERAGE.VCX will make sure
that additional pieces (such as ICO files) will come into the
APP as well.
The engine is careful to store information about the APP
that instantiated it, and to use appropriate syntax to find
its VCX IN a running application as necessary, since Coverge
is a modaless app, it will be instantiating items when this
APP is not actually running. Without the protection of an APP,
however, the SET PATH statement will be necessary. Coverage
subclasses in other locations will demonstrate the same behavior
(they should either be built into an APP or have access to their
own VCX and COVERAGE.VCX via a SET PATH statement).
|
Beyond cov_Engine and cov_Standard, the COVERAGE.VCX classes
can be roughly divided into these groups:
|
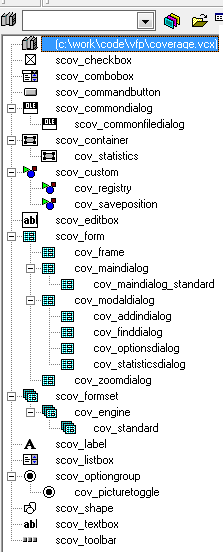
Tune the Coverage header files
The Coverage header file set has a master header file (COVERAGE.H) used by all the Coverage classes. This COVERAGE.H is simply a series of #INCLUDE statements that breaks the necessary #DEFINEs into categories.
If you are interested in localizing Coverage for use in different languages, you will want to look at the strings in COV_LOCS.H. If you are interested in the internals of the Coverage engine, you may want to take a brief look at COV_SPECS.H. However, most developers will be more interested in COV_TUNE.H, where all the constants you can reasonably and safely alter are located.
In this file, you can alter the Coverage Profiler's debugging behavior, its default code marks, the classes it instantiates, the report form used to report on projects, and a whole lot more. If you are planning to subclass the engine, I'd like to draw your attention, especially, to the use of the COV_TOPSPEED #DEFINE, which switches code marking in the engine's MarkTargetCoverage method between a method call to the MarkCodeLine() method and an in-line expression.
Additionally, you'll see the _oCoverage default public reference stored here. The Coverage engine maintains this reference itself (you don't need a wrapper program to do it). A future version of the Profiler, or a subclass that you write, might prefer to place the string that becomes the public reference to the Profiler in a new Coverage registry key.
Take a look at the Cov_SaveState class in COV_SUBS.VCX for an example of a Coverage Profiler subclass that creates new registry keys. Cov_SaveState, and the little custom object it attaches to all the forms in the Coverage formset, creates these keys to save its window positions (for the Coverage frame and each window in the frame). You may want to drop the custom object cus_SaveSate to forms in a completely different type of Coverage interface.
What's really in the log
Have you looked at what happens when you SET COVERAGE to create a log file? The result is a comma-delimited text file, looking something like this:
0.000,,main,8,tastrade.app,1
0.000,,dataenvironment.init,5,orders.frt,5
0.000,,frmorderentry.cbocustomer_id.click,3,ordentry.sct,7
0.000,orderentry,orderentry.refreshcustomerinfo,2,orders.vct,8
0.000,,remainingcredit,5,tastrade.dct,8
0.000,,formisobject,65,utility.fxp,3
The lines above are not consecutive lines from any one coverage log. They are just representative lines from different types of source code, in a VFP 6 log. In VFP 5 they'd look similar but the last column would be missing. In both versions, they ordinarily have some pathing information in the column containing the filename.
Here's what you get:
- The first column gives you the profiling (timing) information for the executed line of code.
- The second column supplies the object record information for VCTs, which holds code in multiple records about multiple objects, each of which can be instantiated separately. (Note: this column and the third column are a little different in VFP 5, but the effect is the same.)
- The third column shows you the procedure
or method executing the line of code. For an APP or EXE this column shows you the
name of the main program. For an FXP or other text file, or a DCT, this column shows
the procedure within the file. It's the same as the filename, without extension,
if the code is in the main program section of a text source file.
For object-oriented code, things get a little more complicated. Since an SCX, LBX, or FRX is considered to have one object instantiated (the DataEnvironment, in a report or label), you'll find the entire hierarchy here, even though the code-in-question may be in one of several records of the SCT. For example, in the frmorderentry.cbocustomer_id.click SCT record above, if cboCustomer_ID was a member of a frmOrderEntry class in a VCX, before this form class was added to the SCX, you may have typed code into this combobox's Click() method in the Form Designer. In this case, its method code is in the frmOrderEntry record of the SCX (identified there in a PROCEDURE cbocustomer_id.click section). On the other hand, if this combobox was dropped onto the form directly in the Form Designer, then the code is in the combobox's own record in the SCX (its code would be identified as PROCEDURE Click in that record.) - The fourth column shows the line number of the executing line. For code stored in memo fields (such as DCTs or SCTs), you'll find these line numbers relative to the method or stored procedure. However, if the code comes from a text-type file (a QPX , SPX, MPX, or an FXP), the line number is relative to the entire text file, even if the code is in a procedure.
- The fifth column tells you the filename for this source code. The filename you see in the next-to-last column is the file storing the object (compiled) version of the source code. In some cases, such as the UTILITY.FXP line above, this information may actually be a record in the PJX rather than a separate file on disk, but the name still represents what this file would be called if it existed! (If it didn't, we'd have no chance to match it up with its uncompiled version for parsing.)
- The sixth column, new to VFP 6, gives you call stack information. It isn't used in the current COVERAGE.APP but the engine makes this information available to you. You can use it to examine coverage dependency, as defined earlier. Later in this paper you'll see that you can easily add to the coverage interface, or design your own — once the engine has organized the information for you.
What's not in the log (uncoverable lines) or unattributable in the log
There are some lines of code that VFP deliberately excludes from the coverage log. This is why the number of lines you'll see in Coverage Profiler statistics rarely matches the total number of lines in the PRG file or method. These lines must be distinguished from "coverable" lines, so they are not counted against your line totals for statistical analysis or show up with erroneous 0 times in profiling figures.
Lines that never appear in the log include:
- comments
- #DEFINEs
- lines between a TEXT/ENDTEXT
- all the segments except for the last line in a concatenated line of code
- DEFINE CLASS/ENDDEFINE and initial property assignment statements in a programmatically-defined class, as well as PROC/ENDPROC lines
- additional keywords such as ELSE whose execution is apparently "assumed" from context rather than actually occurring
If you want to see a complete list of these line types, you can look at the Coverage engine's MarkTargetCoverage method code to see which lines are skipped over for statistical purposes. I don't suggest you actually edit this method, but you can change the display of "uncoverable" lines in the Coverage Profiler quite easily, if you like, by augmenting MarkCodeLine(). This is the engine method that sets up the actual text after the extensive dirty work is done.
Additionally there are other lines the log includes, without attributing to a particular
source code file. These are primarily "interrupts" such as ON SELECTION and
ON ERROR
that can trigger at any point in your code. When you DEFINE a POPUP and issue ON
SELECTION statements, these lines of code execute within the context of your PRG,
method, or MPR, and they are coverable. The Profiler will show these lines as executing
once.
Later, however, you may select that popup bar many times, executing its attached command. Each time, the log will note the execution of an "on selection" interrupt, but it will not attach that information to any source code (because, at that point, VFP has no idea in what source file the ON SELECTION statement exists).
The log and the Profiler cannot show you how many times this code executed. They
will, of course, show you the code that executed in response to the trigger. For
example, if you say ON SELECTION Bar 1 OF MyPop DO MyFunc, all the lines in MyFunc
will be properly logged, and the Profiler will properly account for them in its
marks and statistics.
But this issue of "unattributable lines" points to a second problem with the concept of "100% dependency coverage" statistics. Although in this case you can analyze your code to see in what ways your code might be called, to include such triggers in your "total path" figure, you cannot properly attribute any single execution to these particular paths, so you can never know if these paths were covered.
Where the log information goes: the Coverage workfiles
The Coverage engine organizes the information in the source log within several workfiles. Since the engine is based on the formset VFP baseclass, it is able to keep these workfiles well away from your other work in VFP in a private datasession. However, since this tool exists within the standard VFP interface, you can examine these workfiles easily, by turning your attention to the Coverage datasession. Understanding the structures of these workfiles, and then calling engine methods to act on various cursors of the proper workfile structures, is key to extending and manipulating the Coverage engine.
In figure 11 below I've used the default public variable reference in the Command window to access the Coverage data session. (You can do this directly from the Data Session window's drop down at any time.) I've opened the full set of Coverage workfiles.
The main workfiles are shown here as "Fromlog", which represents the lines from the source log, and "MarkedCode", which holds a list of all the source code items that the engine has identified within the log. Each MarkedCode record has fields to contain the source code in its original state, marked versions for both Profile and Coverage Mode, and statistics for that source code item.
A list of "SkippedFiles" is available to show you which items in the log were not identified (perhaps because you only have the compiled version of the source code or declined to give the engine a path for this file). A list of "IgnoredFiles", which includes the Coverage engine's own source files by default, helps you to exclude files you do not wish to analyze. A list of "PJXFiles" shows project file statistics.
Not all the cursors you see here are always open. You only get a table with project files if you choose a project to analyze from the Statistics dialog, and you don't get a cursor with files that have been skipped unless you choose to see these files from the same dialog.
When you extend the Coverage engine, you'll probably work most often with the "FromLog" and "MarkedCode" cursors. You can think of them as the Coverage "source" and "target" workfiles. In fact, most engine methods that use these cursors refer to them in arguments as "tcSource" and "tcTarget". When you call the engine methods that manipulate workfiles, you can usually call the methods with specific aliases to represent each file.
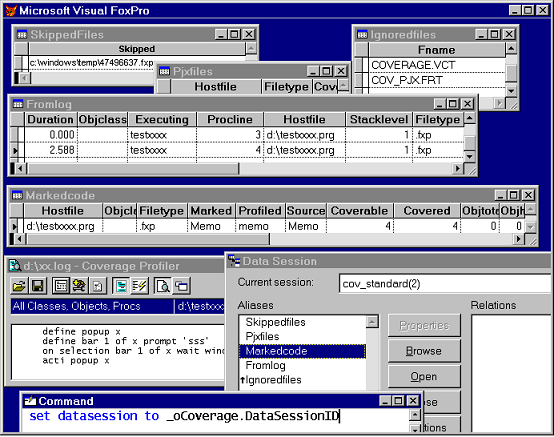 Figure 11. With the data session set to Coverage's own, you can investigate all the Coverage workfiles. |
|---|
Why pass cursor aliases to the engine methods, rather than the engine maintaining information about these aliases? The aliases you see in the figure, and that I have used above to describe the cursors, are the default aliases for all the workfiles. The engine does maintain information about each default alias, but it allows any alias to be used for any of its workfile types, at any time. This allows the engine to analyze many sets of workfiles at once. It is often useful to compare the results of two coverage log runs against each other.
The engine properties that represent the current default values for the source and target tables are called cSourceAlias and cTargetAlias. You can think of this pair of tables as the workfiles that currently "have the focus" in the Coverage interface.
Among your sample AddIn there is one called ADD_LOGS.PRG which adds two additional sets of workfiles into the standard Coverage Profiler interface (see figure 12).
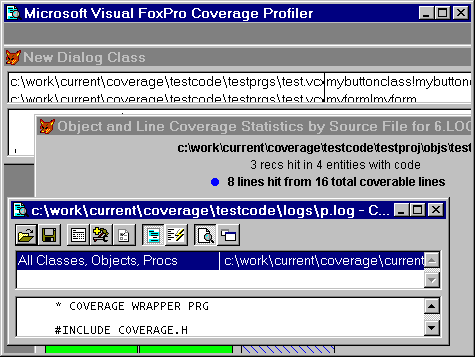 Figure 12. Using ADD_LOGS.PRG, a Coverage AddIn, you can see that the Coverage Profiler can host more than one log analysis at once, in different styles. |
|---|
In this AddIn, each log is displayed using a different interface from the standard main dialog. One of the new interfaces is radically different from the original main dialog, and the other is quite similar. I added these different interfaces to underscore the fact that you can display and manipulate your workfiles anyway you want (also, the standard Coverage engine UI subclass is not designed to manage multiple pairs of main and zoom dialogs).
If you prefer, in your Coverage engine subclass, you could have many copies of the same interface, handling separate logs. Each interface would maintain knowledge about its specific set of workfile aliases, and call engine methods accordingly. The formset's Forms( ) collection will give you considerable help in this sort of design.
Using one engine object to handle multiple workfile sets is a much better use of
resources than instantiating separate engine objects for each log you wish to analyze
and compare. To encourage appropriate resource use, the Coverage engine behaves
as a "singleton"; it will not instantiate two objects of the same Coverage engine
class at once. (You can still have different Coverage engine subclasses and instantiate
them both at the same time if you wish.) If you DO (_COVERAGE) a second time or
otherwise try to instantiate the class again, it will attempt to bring its original
instance forward within the interface.
Testing, and testers, in your team
Let's step back, now, and thinking about the professional place of testing and testers in your team. I said "professional".
This professional, separate activity requires resources allocated to it, and it requires trained people to do it. Users test also — that's a big part of what "user acceptance testing" is all about, after all — but real testing requires repetitive, repeatable, exacting, painstaking attention.
Testing is an activity that should be completely separate from programming. Your own experience should prove the assertion I made earlier in this paper (that testing and logging for bugs separately from fixing bugs makes each bug take less time to fix, and usually renders the fix more reliable as well).
I do not suggest that programmers should not test their own work and be responsible for their own work. There are testing techniques, such as code reviews and walk-throughs, that are uniquely the province of programming professionals, in fact. I only assert that testing also requires some emotional and intellectional distance, and that making testing a separate activity, or (when possible) the province of separate people, provides this distance.
A person who will makes a good tester is patient. S/he has a facility with statistics, and an ability to interpret them. (Testers gather results, but to make sense of those results is a form of data mining that requires experience, instincts, and probably a little magic.) A person who make a good testing professional will have at least a smattering of theoretical knowledge about the subject or a willingness to learn more. (For why you need theory, keep reading.)
Testing also requires that you, as a developer and manager, take a constructive attitude towards defects, and that you display this attitude in your relationship with testers (no matter who your testers are, in the end). This attitude does not result in "carrot-and-stick" approaches to testing. By this I mean that testers:
- are not blamed for finding "too many bugs", no matter how close to a deadline you are or how stressed you are; and
- are not rewarded for bug counts by sheer numbers or any other meaningless metric.
Both points above probably look obvious but — in practice — they often are over looked.
To amplify the first point, I have observed that testers in many organizations are responsible for bug tracking after they report a bug. This is not necessarily a bad idea, but there are occasions on which the tracking and followup requirements become almost punitive, so testers have a disincentive to find bugs. I sometimes wonder whether management in these cases is trying, perhaps subconsciously, to avoid hearing bad news by creating these requirements.
To show you the gravity of the second possible error, I'll illustrate with an anecdote told by Bob Lewis, a regular columnist in Infoworld .(I only half-recall the story, and will tell it as best I can, but I assure you that Mr. Lewis made it far more vivid. I recommend that you all take a look at his column, "IS Survival Guide", for technical management issues. Visit http://www.infoworld.com/cgi-bin/displayNew.pl?/lewis/rllist.htm.)
Imagine that your programming shop produces lawnmowers instead of applications.
Imagine that quality inspectors are rewarded by how many defects they find, regardless of the relative importance of the defects.
(Just for kicks: imagine, while we're at it, that the rest of the production line is treated the same way. The number of defects repaired per day is the most important thing, and number of lawnmowers that must be withheld from sale rather than repaired and shipped out, regardless of the reason, will be counted against them. And imagine that the customer service people are rewarded for number of calls handled per hour, regardless of the quality of help or even consideration they provide, per customer call.)
Now imagine that it is very, very easy to find missing paint flecks on the lawnmower handle. On the other hand, it may take hours of investigation to find a lawnmower blade that is improperly attached... and will fly off and kill somebody.
If you've got this thoroughly in mind (and even if your imagination hasn't extended to the inevitable lawsuits, let alone to the blood and gore), you can appreciate the danger of inappropriately-applied performance metrics for testers and other people in your organization.
Use Multiple Testing Methodologies
Here comes the theory part.
In Steve McConnell's Code Complete (Microsoft Press, 1993), a considerable amount of space is devoted to evaluating effectiveness, and relative effectiveness, of various testing methodologies. I've read plenty of articles espousing a particular technique or touting a specific tool, and more than one other book about testing in general. Nothing, however, in all these evaluations and promotions, has impressed me as much as one argument presented by Mr. McConnell: multiple testing techniques used in concert are invariably more effective than any one technique used in isolation.
Mr. McConnell cites a chart on defect-detection in ten common techniques from Capers Jones' Programming Productivity (reprinted as Table 23-1 in section 23-3, "Relative Effectiveness of Testing Techniques"), from which he draws this inference:
The most interesting fact that this data reveals is that the modal rates don't rise above 65 percent for any single technique. Moreover, for the most common kind of defect detection, unit testing, the modal rate is only 25 percent.
The strong implication is that if project developers are striving for a higher defect-detection rate, they need to use a combination of techniques.
He then supports this inference with data from a study by Glenford Myers, as follows:
When used individually, no method had a statistically significant advantage over any of the others. The variety of errors people found was so great, however, that any combination of two methods (including having two independent groups using the same method) increased the total number of defects found by a factor of almost 2....
Glenford Myers points out that the human processes (inspections and walkthroughs, for instance) tend to be better than computer-based testing at finding certain kinds of errors and that the opposite is true for other kinds of errors. .... The upshot is that defect-detection methods work better in pairs than they do singly.
If there's anything you'll learn from the rest of this paper, and assuming you didn't already know and believe the old saw about "lies, damned lies, and statistics", it's that not all research and metrics provide accurate results. However, I found both the statistics and the conclusions reached by Steve McConnell on this subject quite convincing — because they make common sense.
Bugs come in many species. To catch more than one kind of critter, you need more than one kind of hunting technique. To use more than one kind of hunting technique, you need different weapons and people with different aptitudes.
If you accept this assertion, the requirement for professionalism follows naturally. It's difficult to become familiar with multiple tools and practices, but it's obviously necessary that people doing testing be familiar with multiple tools and practices. These people have to be trained professionals, QED.
I don't have any personal stake in what methodologies you choose. Any combination is better than any one technique, and you should pick from the following possibilities as best suits your development practices and team. Or, perhaps I should say that you should pick the ones that least appeal to you, as a programmer, since these may represent areas in which your programming skills are weak and your code will show the most frequent bugs!
Consider adopting as many of the following practices as you can. Items marked by an asterisk require involvement by developers along with, or in some cases rather than, testers.
*Unit Testing
This is the practice of testing each module and each routine or object in isolation as it is developed, and before it is integrated within a larger system.
Integration testing
This comes after unit testing, and tests the suitability for and connections between a module or routine or object and the larger application.
Functional testing
Similar to unit testing, it tests whether each item, in effect, performs the task it was specified to do, which is a little different from simply "working" from the developer's point of view (which is: "it works, because it doesn't crash"). In my view, functional testing should take place after integration testing, because we're concerned with the ability of the system to provide a feature, regardless of the way the user (or the system) happens to initiate that feature. For example, if a fax should be sent by the system, one "function" of that system is to send the fax. If this "function" is specified to generate a fax log event, then that log should appear regardless of whether the user opts to send the fax manually, from a button on the form or a toolbar or menu item, or whether the fax is automatically sent by the system.
Regression testing
The practice of re-testing all known functions and behavior after changes to the application. This is easiest to do if you have automated tools, a subject I'll cover in the next section.
*Boundary value analysis
A developer has to specify and publish boundary values expected and intepreted by any module. Once this analysis is available, the boundary values should be built into unit and regression tests.
Identification of high-yield test cases
Although this almost always includes testing for boundary values, boundary values are not the only type of high-yield test cases. Testers should identify potentially problematic groups of scenarios and build regression tests that focus on these groups.
Why? because resources are limited, tests need to be run repeatedly, and these test cases will provide the most fruitful testing in the shortest time. As part of this identification process, testing groups should build checklists of known problem areas, including those that involve application behavior (such as a CONFIG.FPW not being properly included with the application files) and those that are external to the application and not under direct application control. (For example, running out of diskspace, user deletes required files, DLLs on target machine are the wrong version, ODBC connection is not properly set up.)
Testing of randomly-generated data
Considering that user-supplied data is unpredictable, and externally-created data is unpredictable, what's an application to do? Why, assume the worst of course, and see how it works when it receives garbage input.
Scaffolding
This is the practice of building small stub programs that allow quick entry into otherwise-complex applications or scenarios, so that they can be more easily and more quickly tested. Again, the aim is to put whatever testing resources you have to the most fruitful use.
Defect logging
Bugs won't do any good if you can't track them to see whether they've been reported earlier, whether they're being fixed, whether they are reported as fixed and need re-testing, how severe their implications are, and so on. I can't tell you what your logging mechanism should look like, only that you need one! Considering the fact that you are database management programmers, you should be able to design a simple app, in-house, if you can't find a commercial tool that suits you for this purpose.
Scenario design and use
This is not strictly a testing problem; you need scenarios to design an application properly. My point here is that the same scenarios and use-cases that you created to design the application should be used to validate the application through testing. Tests should be written specifically to evaluate whether an application fulfills those original scenarios it was designed for. This is a "macro-view" of functional testing. It tests the way functions and features fit together to fulfill the user's real tasks.
*Internal object-state and application-state reporting mechanisms
Can your code provide sufficient information about itself, about current data and object state, as the tester moves through a scenario and performs regression tests? Creating these mechanisms is the province of programmers, strictly speaking. However, testers must be aware of these mechanisms and learn to trigger them — ideally, at any moment during automated testing — for these mechanisms to do much good. In the section on automated testing, below, I'll present an intra-VFP tool that will allow you to trigger such mechanisms.
I'd like to refer you to some excellent code and class design ideas by Steven Black, available in your \TESTINFO folder as S_BLACK.TXT, for one approach to this type of reporting mechanism and how you might build it into your classes. (Contact Steven at mailto:steveb@stevenblack.com.)
To what Steve says in this note, I'll add that I have some performance reservations
about this sort of instrumenting, and you may also. But these reservations are not
serious. You simply need judicious use if #IF/#ENDIF preprocessor directives to
make sure that unneeded code is not generated and that unwanted calls are not made.
(I don't think it's sufficient to simply RETURN quickly at the top of instrumenting
and testing methods like these; to avoid performance problems, I don't even want
the calls made.)
You might think of a #DEFINE trick in your top-level #INCLUDE, and do without any additional adjustments in the rest of your code. Assuming that the SelfTest method in question is not part of the published API of the object — is accessible only internally, the trick might go something like this:
      *** in your top level header file:
      #DEFINE MY_DEBUGGING_SWITCH  .F.

      #IF MY_DEBUGGING_SWITCH
          #DEFINE THIS_TESTING   THIS.SelfTest
      #ELSE
          #DEFINE THIS_TESTING   NOTE
      #ENDIF

      ***** in your class code

      DEFINE CLASS myobj as custom

         PROC Init
            THIS_TESTING("Init")
         ENDPROC

         PROC SelfTest(tcArg)
            WAIT WINDOW tcArg
         ENDPROC

      ENDDEFINE
Automated Testing
Since testing takes time and resources, it only makes sense to avoid wasted resources and time in testing. Automated testing techniques have this benefit.
Some pros and cons
Automated testing also, I've observed, has the benefit of reducing emotional investment in this emotion-laden process. The automated test is harder to get mad at, and provides a more consistent response, with affect-less reporting, than other types of bug reporters. Between the general stress of application development and the "performance anxieties" that bugs represent for many developers, anything that can reduce the emotional hazards of the testing and bug reporting process has to be a Good Thing. I'd go so far as to say that automated testing is an important part of improving your development process, full stop.
However, I've also observed that people put a little too much faith in automated testing at times.
Automated testing does not mean you don't have to think about testing. Nor does automated testing save you a great deal of time — at least, not initially.
Designing automated tests take a lot of time up-front, even though they may save you time down the road. This is analogous to the fact that designing a really good abstract class, to fulfill many requirements, takes a great deal of up-front time, even though its subclasses may be easy to write. Another similarity is that automated tests, like good abstract superclasses, take a lot of experience. You're going to do this wrong, the first three times out; it's like OOP all over again <g>.
Even when you have set up a well-defined and robust automated testing process, and know your automated testing tools inside and out, it still takes time to create the scripts, customized for each application or each test scenario, for your automated testing tools to run. This fact seems to be true no matter what tools you use.
You still have to think. And it still will take you time. But automated testing can be more consistent, more objective, and more productive than not doing automated testing. With this in mind, we have to think about how we can implement this practice in VFP.
Automated Test Options in VFP
Your options will break down into the following groups.
Intra-VFP automated routines
These have the benefit of allowing access to any VFP commands and methods (from
Steven Black's object methods to a LIST STATUS TO
<file>) you wish to use to "peek" at object states or other status indicators, at any
point within your application. They also have the benefit of working with VFP's
non-standard controls. They often do not work well with ActiveX controls.
Extra-VFP automated script runners under the Windows OS
These work really well with ActiveX controls (or most of them), but you lose the benefit of running VFP code as described above.
Many of them also tend not to work with VFP's own control set. For example, Visual Test cannot work with VFP's so-called "painted controls" without some astounding, and somewhat limited, trickery. The \TESTINFO folder contains VIS_TEST.HTM, a file that describes why Visual Test commands ordinarily used to perform standard actions on controls (such as Click) do not work with all VFP controls. (Incidentally the problem occurs in Word 95 and Access, too, we aren't the only mavericks.)
Instead, you can use Visual Test's "scenario recorder", as explained in this article, to capture the actions, and then use Visual Test's "Play" command to play back the appropriate actions. However, this method is limited by the fact that it relies on physical coordinates of these controls rather than truly addressing the controls themselves. It hardly uses Visual Test's full set of features and facilities.
Visual Test is not capable of being an OLE Automation client, and therefore can't control VFP using VFP as a server through normal means. However, your \TESTINFO folder also contains an article by Calvin Hsia, C_HSIA.DOC, in which he describes a method of invoking Visual FoxPro commands from a Visual Test Basic script. Visual Test loads FPOLE.DLL, where VFP's OLE-server capability actually resides. Thereafter Visual Test can access FoxDoCmd and FoxEval from FPOLE.DLL.
I must tell you that I have practically no experience with this technique — and absolutely none in VFP 6 — but I recommend that you think about using these ideas if you want to use Visual Test with VFP. I think that using this in combination with the "scenario recorder" facility might give you something usable.
As an alternative, I have been successful with a shareware automated playback device called Macro Scheduler (shown below). You'll find some information on this tool in \TESTINFO\MSCHED.TXT as well, and there is quite a bit of information on my work with Macro Scheduler in tandem with Runner, described later in this section, in the Runner help information.
In Windows 98 and the latest versions of IE, there appear to be scripting facilities that take the place of the old DOS Batch language. I have little hard information about this to share with you, as yet, and even less information about how I'd recommend you integrate them into your VFP testing routines. However, this is an ever-changing field and I am looking forward to learning more about these facilities soon.
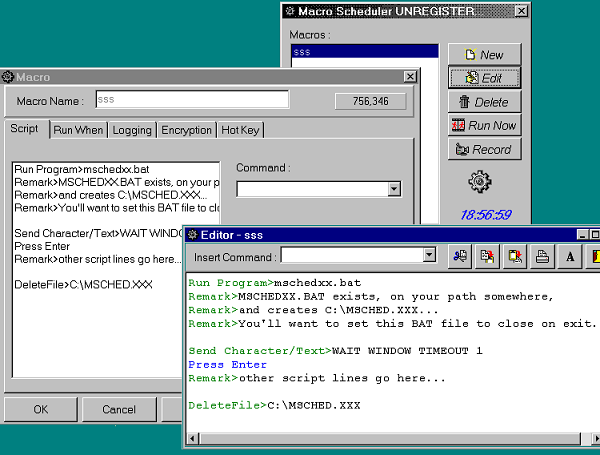 Figure 13. Macro Scheduler is a shareware application for Windows scripting that successfully integrates with VFP Runner scripting with a few tricks. |
|---|
Extra-Windows automated tools
The "high road" of this group of tools is an integrated hardware-software approach that is "non-intrusive" (outside the operating system). A testing tool of this nature can be said to be most "objective" because it's outside the normal system's running resources. It also has the benefit of being blind to VFP controls' differences from standard MFC Windows control classes. In fact, one such tool (AutoScriptor by Automated Solutions, Incorporated), makes a point of including VFP among the "non-standard" applications it supports.
On the downside, such a tool is necessarily expensive, and can be somewhat cumbersome to set up and implement. Since it is outside the operating system, also, it mimics user interaction with the application (keyboard and mouse) but cannot use any other system calls or influence the application in any other programmatic way.
You'll find some limited text about AutoScriptor and Automated Solutions in the \TESTINFO folder (AUTOSCR.HTM and ASITEST.HTM). If you are interested in this solution I urge you to contact http://www.asitest.com directly, for more information.
Runner plus...: A hybrid approach
Just as a combination of testing techniques will net you a higher bug count, I feel a combination of automated testing techniques can help you cover all the bases.
I've written a VFP autorunning object I call "Runner", which you can add to VFP applications or the VFP environment quite easily. Runner has both autotesting and self-running demo applications. It is a "smart" timer object, which works by scanning through a DBF of script actions that you prepare. For each type of action (and Runner's scripting action types encompass most of what you can do in VFP), Runner disables itself until the action completes and then re-enables to execute its next script action.
Allowable Runner script actions run the gamut from mouse-handling through execution of entire programs you indicate. Runner understands the grouping of actions into something I call "phases", and you can designate phases, or single action records, to be repeated as required. Special provisions are made for logging, both of errors encountered or of messages you designate as the script progresses. I'd also suggest you think about running some of Steven Black's state-snapshot-dumping methods via a Runner action at various points in your script.
In view of Runner's timer implementation, the most problematic actions are actions
that return to Runner before the action completes. These actions include both native
PLAY MACRO statements and actions that run an external Macro or scripting facility.
Briefly, you need to provide Runner with some help to wait until extensive macros complete, whether they're external or internal. I've got a few suggestions for you that will help. (You can actually see one of the suggestions under construction in figure 13 showing MacroScheduler above. See RUNNER.TXT in the \RUNNER folder for more information.) Although these suggestions work, it's also best to set your Runner Interval high enough to allow for these actions to "proceed naturally" if possible. You can even temporarily adjust Runner's Interval just before and after any macro-running script action.
I've made provisions to integrate Macro Scheduler into the Runner set of allowable action types. I think that this hybrid approach allows me to handle OLE objects, mouse menu objects, and other "tricky" actions with the greatest flexibility, while still allowing me VFP's full range of abilities in other respects. I would like to integrate other external tools into Runner scenarios as well.
If you know you have access the Windows Scripting Host object on your test machines, you can avoid the problems with RUN and wait state handling. This is something I haven't had time to integrate with Runner yet, because I'd still need to ensure that this object was available and revert to RUN if it were not. In your environment, however, and your subclass of Runner, you can use the object's Run method without worrying about this.
There is very little else you have to know, to use Runner. I've prepared a demo application (in the \DEMORUN folder) with a demo Runner script table, so you can see how Runner works. Since the addition of a Runner object is really the only change I've made to a generated VFP 6 Framework app for this demo, I haven't bothered giving you the source. You'll only find the APP, its data, the Runner script table, and a macro file the Runner script loads.
Since this demo project is a generated application, using the VFP 6 framework and application wizard, its objects refer to many other VFP 6 classes and FFC components. Since the demo app is a VFP 6-framework application, you can't run the demo in VFP 5. However, I think Runner and its FRONTRUN.SCX delivery device, described later in this section, will work fine in VFP 5, if you need it there.
There is no necessary connection between Runner and the framework used to create this demo application.Still, the small additions to the app_application object in this project will give you some extra help on integration of a Runner object into any type of application. Here are all the changes I made to the generated app_application object in the demo framework project:
- I added a Runner member to the app_application container.
- I edited the Runner member's Error method, to give the application's general
error handling precedence if an error occurred within Runner code itself (this is
not a requirement, just a personal preference):
            LPARAMETERS nerror,cmethod,nline

            IF nError # 1540

               * I know there is going to be an error of

               * this type on the way out, and in

               * this context the error is meaningless

               THIS.Parent.Error(nerror,cmethod,nline)

               DODEFAULT(nerror,cmethod,nline)

            ENDIF
-
I made sure the Runner object would know when an error occurred within the application
I was testing, by adjusting the app_application's Error method. This is something
you should always find a way to do, if possible, because you may need to skip over
some actions after the current action if an error occurs. Because of Runner's Phase
concept, which groups actions into separate tasks, you can still go on with the
rest of the script after the current Phase:
            LPARAMETERS nerror,cmethod,nline


            DODEFAULT(nerror,cmethod,nline)


            THIS.cusRunner.lError = .T.
- I gave the app three new custom properties: cRunnerDBF, iAutoRunInterval and lInAutoRunMode. I added the name of my script table as the value of my cRunnerDBF property, and set an appropriate default interval as the value of the iAutoRunInterval property.
- I created an access method for lInAutoRunMode, as follows:
RETURN THIS.iAutoRunInterval > 0 ;

                AND VARTYPE(THIS.cRunnerDBF) = "C" AND ;

               (FILE(THIS.cRunnerDBF)  OR ;

                FILE(THIS.cRunnerDBF+".DBF"))
- I adjusted app_application startup procedures to handle an "auto run" mode,
by putting this code in the BeforeReadEvents() method. If the application should
"autorun", the values of the cRunnerDBF and iAutoRunInterval properties of the application
object are applied to its Runner member' properties, and the Run() begins:
LOCAL llReturn

llReturn = DODEFAULT()

IF llReturn AND THIS.lInAutoRunMode

    THIS.cusError.lServer = .T.

    * the above is a convenient way

    * to make sure that the app

    * keeps running after logging app errors — not strictly

    * necessary but it helps make sure that

    * Runner goes on to the next phase smoothly if

    * an error occurs in the app.


    * I've also augmented the Error


    * event of this app's Runner member to call

    * the app's error method, so that error logging occurs

    * even if a Runner method causes the error.

    * The lServer mode of the cusError object will

    * make sure we don't get "stuck" in error dialogs if

    * this happens.

    WITH THIS.cusRunner

        * here you could make an evaluation —

        * is this an autotest (set the interval fairly

        * low) or is it a Demo run (set it higher,

        * so people can see what's going on)

        .cTable = THIS.cRunnerDBF


        .Interval = THIS.iAutoRunInterval

        .StartRun()

    ENDWITH

ENDIF


RETURN THIS.IsErrorFree() AND llReturn
- Because it didn't make sense to me to show the Quick Start form at the beginning
of the application if I was trying to create an "auto run" of the app, I added this
code in the app_application's ShowStartupElements() method (this is completely optional
and specific to the framework as well):
IF THIS.lInAutoRunMode

    THIS.lStartupForm = .F.

    * It just seems like a reasonable thing

    * to do!

ENDIF

RETURN DODEFAULT()
As a general rule, integration of Runner with your application — however your application is organized — consists of these factors, consistent with the changes I've just listed:
- proper recognition by the application of when it should, and should not, be in "auto mode"
- some adjustment of your application's error handling (if you have not otherwise provided for this) to run without user intervention when necessary. (The demonstration script table for the DEMO project includes a deliberate error, so you can see how Runner attempts to recover from any such event.)
- 3. optional integration of Runner's Error event with your application's error handler, so that any intra-Runner error calls the same error logging system that normal application errors would trigger
- 4. optional recognition by any application elements that they are in a "special
situation" when in "auto mode", such as the adjustments to the lServer property,
switching error handling to
WAIT WINDOW NOWAITs fromMESSAGEBOX()s, and the change to lStartupForm, that you see in the example code above
In the DEMORUN example script table, an error is deliberately caused so that you can see how Runner exits an error-causing phase and attempts to continue on with the rest of its script. After the error, part of the script shows off some of the framework's capabilities, by bringing forward the error log viewer and dynamically changing its font using the options dialog.
Watch your VFP status bar at the end of the Demorun. If you have the status bar on, you should see Runner continuing to go through some additional records before it finally finishes. Afterwards you can examine its *.RUN log, to see what happened.
During the run, WAIT WINDOWs also show up to describe what's going on — these are
INFO instructions in the demo script itself. Runner's INFO action type, which creates
these WAIT WINDOWs, is very useful for both testing and demo purposes.
The hard part of using Runner is not its simple API. You'll find this documented in RUNNER.TXT. (Runner is very much a work-in-progress, and RUNNER.TXT is "it" for the moment, and it's not pretty. But it is thorough!)
The hard part of properly testing with Runner is the same as it is for any automated testing: you have to devise appropriate testing scenarios and then write the scripts to automate these procedures.
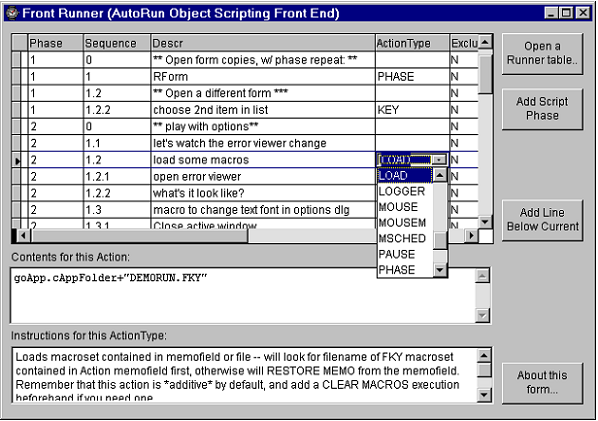 Figure 14. Macro Scheduler is a shareware application for Windows scripting that successfully integrates with VFP Runner scripting with a few tricks. |
|---|
For this reason, I'm delivering a simple front end to Runner script writing, which I call Front Runner. If you DO FORM FRONTRUN (in the \RUNNER folder), you'll find that it examines and creates Runner scripts without much validation for your "script action" entries but with a table-driven approach to allowable action types, and information on each type available. In figure 14 above , you can see the DEMORUN\DEMORUN.DBF script table under edit.
You'll need more help...
Well, it's a start.
This article and the tools represented herein are only a beginning. COVERAGE.APP facilities in VFP 6 are a big help, but as you've already seen you'll need to interpret and use the results before your applications will benefit.
Luckily, as I hope you've also already seen, VFP is such a brilliant environment in which to write tools, and in which to analyze results, that you are a leg up on the competition before you begin!
It can truly be said that testing is not quality assurance. Use of what you learn from tests, deployment of testing information accurately and with constructive care, results in quality.
When used properly, testing becomes an important part of a full quality-assurance process. You'll need a practical plan to encourage testing, and testers, in your organization. I've enjoyed writing these notes to give you some ideas.