The title gives away the punchline on this one…
Also, does anyone know how to make the output filename end with .XLS in an emailed SSRS Subscription with the “XML file with report data” option? The emailed file from the Subscription comes out as *filename*.xml and my users will be very confused with an XML file versus a XLS file.
and at least one other person (Sanket) appeared to have a similar problem last November:
Hi,I want to change name of report file when exporting to excel.
i have got no idea how to do it.
Please help
… which certainly makes it a question worth answering. I asked Sanket this:
Sanket: are you exporting using an application? Or is the user doing the export from ReportViewer or Report Manager? Or what?
… and you’ll see why shortly.
Before I answer, the inevitable caveat
Folks, while an XML extension may be confusing, consider the following:
- If the user’s computer has ever had Excel 2003 installed on it, chances are that a double-click will open the file in Excel by default, and the XML file will show an appropriate/specialized icon to show that it is an “Excel XML file”, not a standard XML icon. Not terribly confusing. How does this work? It’s all down to the processing instruction that we added to the SSML:
<?mso-application progid=”Excel.Sheet”?>
This screen shot shows you what it looks like when it works as expected (remember, this will be different depending on the client computer; for example, the Standard XML file icon you see here belongs to Stylus Studio, because that’s my default owner for this type of file on this computer):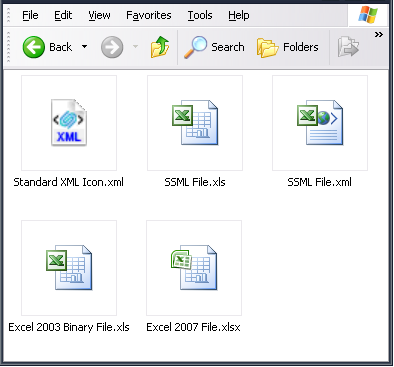
- If the user has Excel 2007 installed as the default owner for files with an XLS extension, and the file is really SSML rather than Excel binary, the result they will when they doubleclick is a warning like the following:
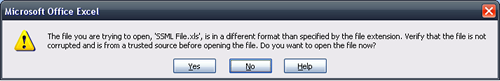
Naturally, you can tell your users to ignore this warning and answer “Yes” to the dialog. But it’s not exactly what I would call un-confusing.
So, IMHO… you pays your money and you takes your choice. With that understood, let’s address the stated requirement.
The short answer is “no”, but we don’t care.
Try to remember that the default subscription interface you see in Report Manager is just a basic UI given to you by default.
Just like the parameters panel for ReportViewer, which we all love to hate, there’s nothing intrinsically required about it.
Just like the Excel renderer can be obviated by creating our own SSML from the XML output, the base Excel rendition isn’t the one we have to accept.
A subscription is just a timed task or job. If you look at SQL Agent, it looks something like this:
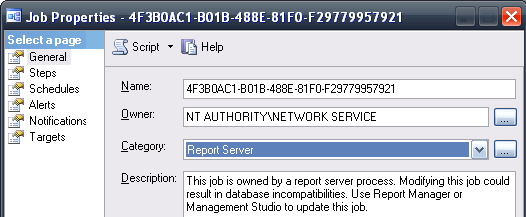
The one step in the job looks something like this:
exec ReportServer.dbo.AddEvent
@EventType=’TimedSubscription’,
@EventData=’512f89b1-7dd8-4b2f-806b-29927da7a81e’
… and the code underneath is probably not very complicated either, although I’ve never looked. (That would be like trying to fix the default Excel renderer.)
Let’s leave it alone, and think about the right way to fix our problem here, which (from Cliff’s point of view) is that you are allowed to set the full name of the output file when it goes to a file share, but you’re not allowed to set the extension when you send the subscription to an email address.
We won’t need any grenades
This is actually an easy problem to solve, several different ways (remember the paying the money and taking the choice part?)
Here’s a overview of how to do this thing.
Start with the knowledge that this is just a timed task, and write your own! It will be very simple, and SSIS is probably the most natural approach (but if you don’t like it you don’t have to use it, as you’ll easily see).
-
Use a fileshare subscription, or…
- If you’re using SSIS, you can invoke the subscription yourself. Or use a file watcher task (these are available from better SSIS jockeys than me, so check it out) and stick with the standard subscription schedule.
Method notes: You don’t need to use the code you see above, you can just use exec sp_start_job. (That’s one reference. You’ll find others, I’m sure. It turns out this is pretty much an FAQ.) - Pick up the file and rename it.
- Email it out.
- If your subscription was data driven, you should be able to look at the same data as RS does, to figure out to whom you email.
- Emailing is simple, whether you use a purpose-built SSIS task or your own code.
- If you’re using SSIS, you can invoke the subscription yourself. Or use a file watcher task (these are available from better SSIS jockeys than me, so check it out) and stick with the standard subscription schedule.
-
… Skip the subscription altogether. Create a timed task or SSIS job that does what you need, without one:
- Retrieve the report yourself, with minimal code.
- You can use either SOAP or REST to do this.
Method notes: I’ve shown several examples of how to do this on this blog already, but I’ll add another example here, which shows a Q&D REST approach to doing this inside SSIS. It comes from my xmlRSDocs processing code, but you should be able to see how to apply it.
I’m posting this bit because I think I remember having to help somebody with the correct classes to use for a low-level post approach like this, when working inside SSIS, once. - Here’s an alternative — you’ll find many — for invoking RS inside SSIS, and this one uses SOAP. I think this is a bit overcomplicated and I think you can apply some of my other instructions for SOAP invocations more easily, including one SOAP version done quite recently. But maybe this one is more “orthodox”, so I don’t want to push my methods on you..
- You can use either SOAP or REST to do this.
- Obviously when you’re picking up the file yourself, name it anything you want.
- As above, email it out.
- Retrieve the report yourself, with minimal code.
That’s about it. Here’s the REST example I promised; this is the code from an SSIS script task.
Public Sub Main()
‘ a script task to grab an SSRS report
‘ from within SSIS, based on some
‘ specialized package variables that make
‘ sense in my scenario. Your scenario is
‘ different, but the basic idea will work for you.
Dim outputFile As String, requestURL As String
If Dts.Variables(“ExportRSType”).Value.ToString().Length = 0 Then
Dts.Variables( “ExportRSType”).Value = “PDF”
End If
outputFile = Dts.Variables( “ExportRSFilename” ).Value.ToString()
If System.IO.Path.GetDirectoryName(outputFile) = “” Then
outputFile = Dts.Variables(“InputDir” ).Value.ToString() & _
outputFile
End If
outputFile = System.IO.Path.GetFullPath(outputFile)
requestURL = _
Dts.Variables(“ExportRSURL” ).Value.ToString()
requestURL += _
“&rs:Command=Render”
requestURL += _
“&rs:Format=” & Dts.Variables( “ExportRSType” ).Value.ToString()
‘ this part is a little kludge because of
‘ how I set up my URL template variable
in the SSIS Package… not really germane:
If Len(Dts.Variables( “ExportRSParams”).Value.ToString()) > 0 Then
requestURL += _
“&” & Dts.Variables( “ExportRSParams”).Value.ToString().Replace( “^”, “&” )
End If
Dim ox As System.Net.WebRequest = _
System.Net.WebRequest.Create(requestURL)
ox.UseDefaultCredentials = True ‘TBD…
Dim oy As System.Net.WebResponse = ox.GetResponse()
Dim raw As System.IO.FileStream = _
New System.IO.FileStream(outputFile, IO.FileMode.Create)
Dim buffer(1024) As Byte
Dim rs As System.IO.Stream = oy.GetResponseStream()
Dim read As Integer = rs.Read(buffer, 0, buffer.Length)
While (read > 0)
raw.Write(buffer, 0, read)
read = rs.Read(buffer, 0, buffer.Length)
End While
oy.Close()
raw.Close()
raw.Dispose()
rs.Close()
rs.Dispose()
oy = Nothing
ox = Nothing
raw = Nothing
rs = Nothing
Dts.TaskResult = ScriptResults.Success
End Sub
… OK?
None of this stuff is magic.